

Somewhere between 70 and 100 reverse stock splits execute in the US every month, and almost all of them start as sub-$1 microcaps trying to game their way out of a Nasdaq delisting.
I started collecting them into a calendar earlier this year, mostly out of curiosity, but the numbers around them turned out to be so clean and predictable it made it impossible not to take a more serious look.
That calendar now lives in our enriched reverse-split dataset
Eventually, that experiment led to another experiment, which led to another one after that, and is ultimately why I can say with extreme confidence that there’s probably never been a better time for short selling.
Now, in just the title alone, we’ve already made pretty big claims about how good this space is, so to actually back up those words, let’s start from the beginning.
It doesn’t get easier than a reverse split
When a stock closes under $1 for 30 straight sessions, Nasdaq sends out a deficiency notice. In order to stay listed on the exchange, all the company has to do is bring its price back up to that $1 minimum.
Note how price is emphasized; not market value, revenue, or anything beyond just the surface-level optic of price.
Knowing this, the de-facto solution for these companies is a reverse split, where they consolidate 10, 30, or even 50 shares into one, and the delisting problem disappears overnight.
The company itself doesn’t change at all and still has the same cash burn, the same need to continuously dilute, and the million other problems that got it there in the first place.
To give a relatable example, Beyond Meat ($BYND) has been doing this all year:
The share count went from 76.5 million to 515.8 million
Once the stock was trading in the thirty-cent range, the company executed a 1-for-30 reverse split on August 14 to beat the August 31 compliance deadline
Now, one of the challenges in shorting broken companies is that some of the best candidates are often already trading below $1, which most brokers don’t allow you to do.
However, if that candidate just executed a reverse split and became eligible for shorting again, one can ask a pretty simple question:
“If the business model is still broken and the company is still expected to perform poorly, couldn’t you just continue shorting it now that the restriction is gone?”
Intrigued by the question, I pulled the data for every reverse split from January 2024 through July 2026, with a crude strategy of shorting at the next session’s open and holding for 30 trading days.
To filter out un-tradeable noise, I also applied a $1 minimum price and a $100k minimum average daily dollar volume, so sub-dollar zombies with no borrow don’t give misleading results.
For this first, crude experiment, the numbers weren’t too bad:
1,373 tradeable events, out of about 2,700 raw splits (the rest had no listed price data or were under the sanity floor described above)
Mean 30-day short return +7.7%, median +16.6%, hit rate 69%
The mean and median have a large spread due to the left-tail nature of short positions, where the worst single event,
BNAI, cost the short over 2,000% of the position
Interestingly, academia found the same drift decades ago, where a 2008 Financial Management study of 1,612 reverse splits showed significant negative abnormal returns for three years after the split.
Now, one of the advantages of doing this for some time is that you gain the ability to tie an older experiment to the results of a new experiment, allowing for a more effective version that other participants couldn’t build.
We’ve covered similar effects existing in stock dilution events, so that made me curious to see what would happen if we segmented these reverse split events by those who also have a history of repeat dilution.
Fortunately, that extra umph is what made it a viable strategy:
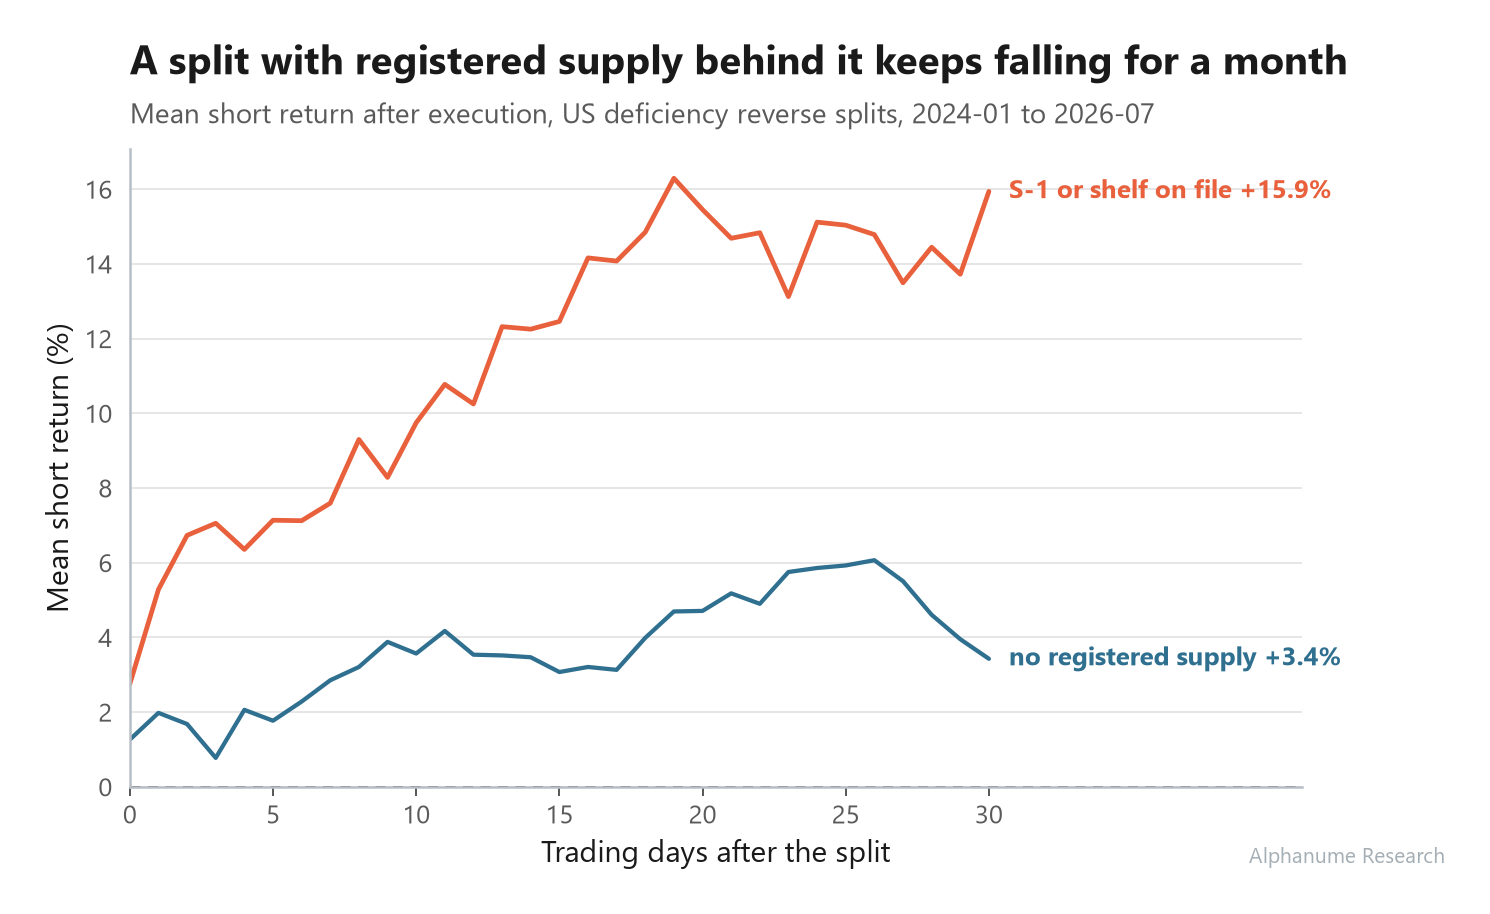
We found that shorting reverse split events in companies with a history of dilution returned +15.9% (9.9% net after a fixed 50% annualized borrow cost assumption) per position over 30 days, at a 77% hit rate.
Machine learning still has some juice
With renewed confidence that short-side edge still exists in relatively untapped areas, I went through some of our old files to see if anything useful still held up.
Back in the early days, when machine-learning models were my first weapon of choice, I remember building out a classification model to track a market phenomenon you’ve probably seen before:
Stock XYZ with a $20m market cap is up 150%+ in early pre-market and gets plastered over 100 retail-focused screeners (e.g., “Pre-market movers”)
In the best case, it’s tied to a vague “AI” or “crypto” press release
In most cases, you wouldn’t be able to find a real catalyst even if you tried
By the end-of-day close, the stock has either gone negative or is substantially down from its pre-market headline
This repeats the next day, but with a new stock
Most of this is attributable to shaky price discovery during illiquid periods, but a meaningful chunk is tied to bad actors running pump-and-dump schemes.
We built a model for exactly that, where given only information available 30 minutes prior to the open (e.g., return distribution, size), we’d have a probability of whether the given premarket ticker would drop by 5% or more by close.
We now publish those daily rankings through Alphanume’s Pre-Market Drop Risk dataset, with each name’s model probability and subsequent outcomes.
To see if it still worked, we re-ran the strategy over the same multi-year test period as above, where we’d short at the 9:30 open (MOO auction order) and buy back the position at close (MOC order).
Surprisingly, it still works:
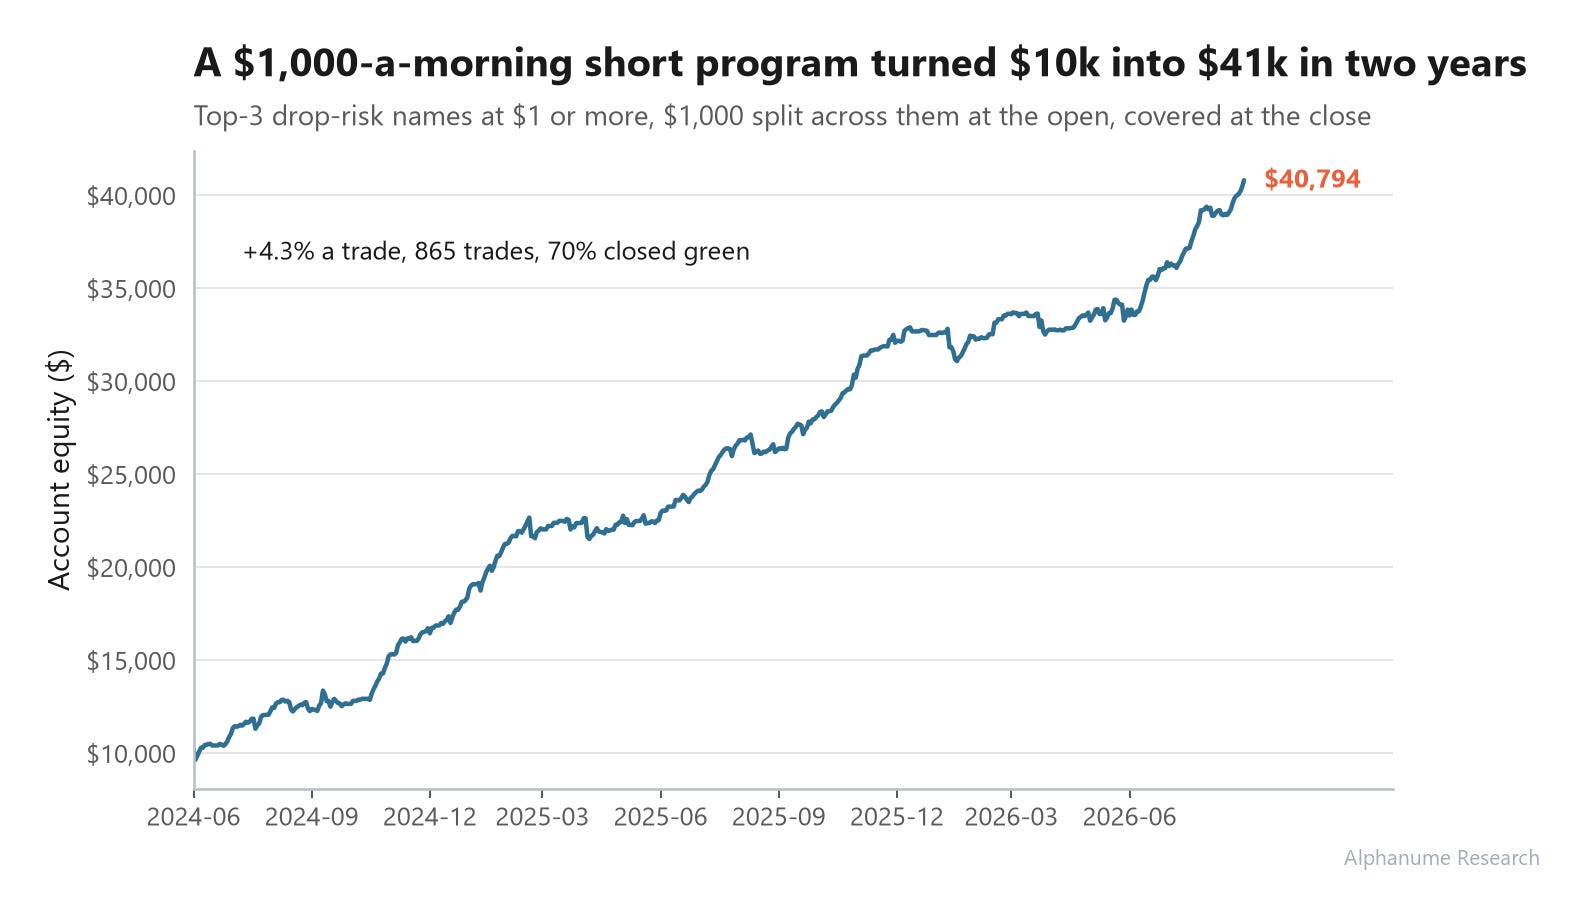
865 trades across 485 sessions since May 2024
Mean return +4.3% per trade, with a 70% hit rate
Concentrating helps, as the day’s top-1 highest probability name alone averaged +6.1% per trade
Extending the position duration also helps, where holding the same shorts for 5 sessions averaged +11.1%
The equity curve (below) immediately raised every “you probably overfit somewhere” flag in the book, but after trying to break it some more and not getting anywhere, I’ll just let you be the judge (replication instructions in the final section).
Now, being transparent, the reason we didn’t keep running this model when we had it is that this is almost entirely in the realm of low-capacity trades:
Many of these companies are low-volume from the start, so any position size north of even $10k can sometimes be 5%+ of historical ADV, which will give you partial fills when using auction orders
Full automation is difficult as these are all HTB, so even though locate fees are manageable at places like TradeZero and Centerpoint (e.g., $0.04 per 100 shares), you still have to actually press the button
When running this live, we used CSV basket orders to speed things up, but even that was tough as any partially filled leg threw off the target equal weight allocation
So, while this can still work magic for a few thousand bucks, we’d be lying if we said it’s a million-dollar compounding machine.
Pounding the table on dilution, again
This post is already getting a bit lengthy, but we’d be doing a massive disservice to you if we didn’t mention the last leg that we’ve already been running live.
We’ve written about it recently, but shorting small caps that file dilutive S-1 registrations is still one of the lowest hanging fruits in this space.
For quick context, an S-1 registers new shares in companies that usually need the money badly. Despite the announcement being priced-in rather quickly, shares continue to go down abnormally as the new lack of shareholder incentive combines with the already dim outlook on the company’s future.
A few days ago, I publicly shared the performance (link above) to show that the edge still survives out of sample:
301 tradeable filings, mean 30-day short return +26.3%, median +31.5%, hit rate 82%
Again, being transparent, we recently tried the same strategy with the cousin of this (shelf registrations) and found it wasn’t that effective, running at +1.8% on average, with a 57% hit rate.
You can inspect a delayed sample of the S-1 filings here, including the company, shares registered, and market cap, without creating an account.
You’ll blow up if you don’t combine them
In short selling, you will eventually have a position that goes up n standard deviations against you. It might not happen in the first 100 trades, but it is almost a guarantee that it’ll happen at some point.
The best solution I’ve found for this is “simply” running the multiple strategies as a diversified book, so that one day’s strategy loss can be offset not just by the smaller allocated size, but ideally also by the gains of another strategy.
“Simply” in quotes, as each strategy might have non-overlapping exposure periods. For instance, the pre-market list updates every morning, but reverse splits execute in weekly clumps, while S-1s arrive most evenings.
To make it easier for you, we can walk through a sample framework:
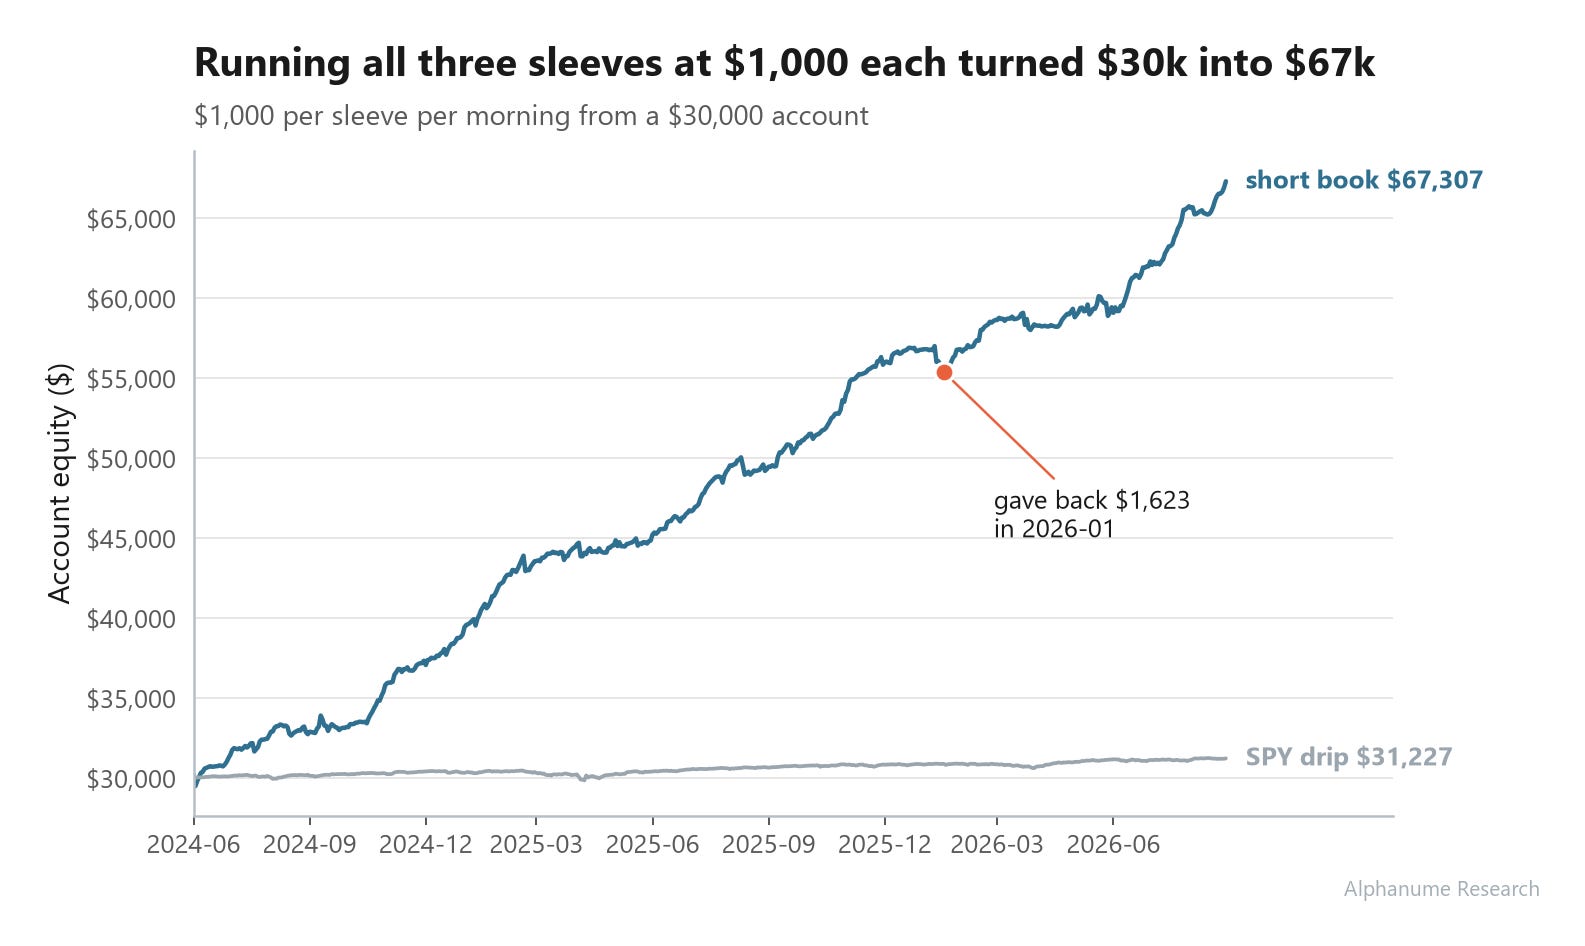
A $30,000 account puts $1,000 behind each sleeve each morning, split equally across whatever positions that sleeve has open that day
A sleeve with nothing on keeps its $1,000 in cash
A position’s one-day loss is capped at -100% of its slice
Position sizes stay fixed in dollars, with no compounding (compounding full size in microcap shorts is unrealistic)
Over 561 sessions from June 2024 through August 2026, the combined book of strategies grew from $30,000 to $67,307 (+124%), while dripping the same $3,000 a day into SPY finished at $31,227 (+4%).
Broken down, that comes out to roughly $16.5k a year of P&L against $3,000 of gross short exposure, with 72% of days positive (chart below).
Final Thoughts
None of the inputs here are secret, as reverse splits are announced in press releases, S-1s and shelfs sit on EDGAR, and pre-market movers are on every dashboard.
The reason they aren’t talked about as much is that putting it all together took deep domain experience and hard data work.
However, all of this is now accessible through an API call, which is pretty much my whole case for framing this as the golden age.
All three datasets covered here are available through Alphanume Pro, with their available history and ongoing updates through the dashboard, REST API, and hosted MCP server, at $99/month.
If you want to run or model any of this yourself, you can go two ways:
Manual pipeline
Pull the event calendar (reverse splits, S-1s, or the morning drop-risk)
Enter at the next session’s open, and apply the same tradeability floor ($1 and $100k daily dollar volume is what I used)
Hold 30 trading days for the filing-driven trades, or close at the bell for the pre-market tranche
Before sizing anything, get a real borrow quote to simulate the interest costs
Give it to Claude
We run a hosted MCP server, and the setup takes about a minute:
Open Settings in Claude, then Connectors, and click Add custom connector
Paste
https://mcp.alphanume.com/mcpas the server URL and confirmClick Connect and sign in with your Alphanume account
From there, all 25 datasets sit one plain-language question away, so here’s a few prompts worth stealing:
Have it build the production plumbing: “watch the reverse-split calendar and alert me the day before any split with an S-1 or shelf on file executes”
Have it go deeper than I did here: “re-run the reverse-split short with a 60-day hold and a hard-to-borrow fee assumption, and show me where the edge dies”
Or have it hunt for an edge that’s fully yours: “cross reference the premarket drop-risk list against the SEC filing intensity and Wikipedia-attention feeds, and show me whatever filter survives”
So, hopefully we’ve given you enough evidence to back up our confidence on this. We’ve long believed that there’s a much bigger world out there than the vanilla “buy large-caps” you see on Bloomberg, and for once, the data actually agrees.
As always, thanks for reading, and we’ll see you in the next one.