

You’ve probably heard of CTAs, Commodity Trading Advisors, but odds are, you likely don’t know what they actually do all day.
In short, these are just a breed of funds that exclusively trade futures like oil, nat gas, coffee, and so on.
What got me interested in these was seeing the headlines you’ve also likely seen, about how the 10-year Treasury yield has been on a non-stop rally back to 2007 highs.
But more importantly, it looks like it’s a major trade on CTA desks:
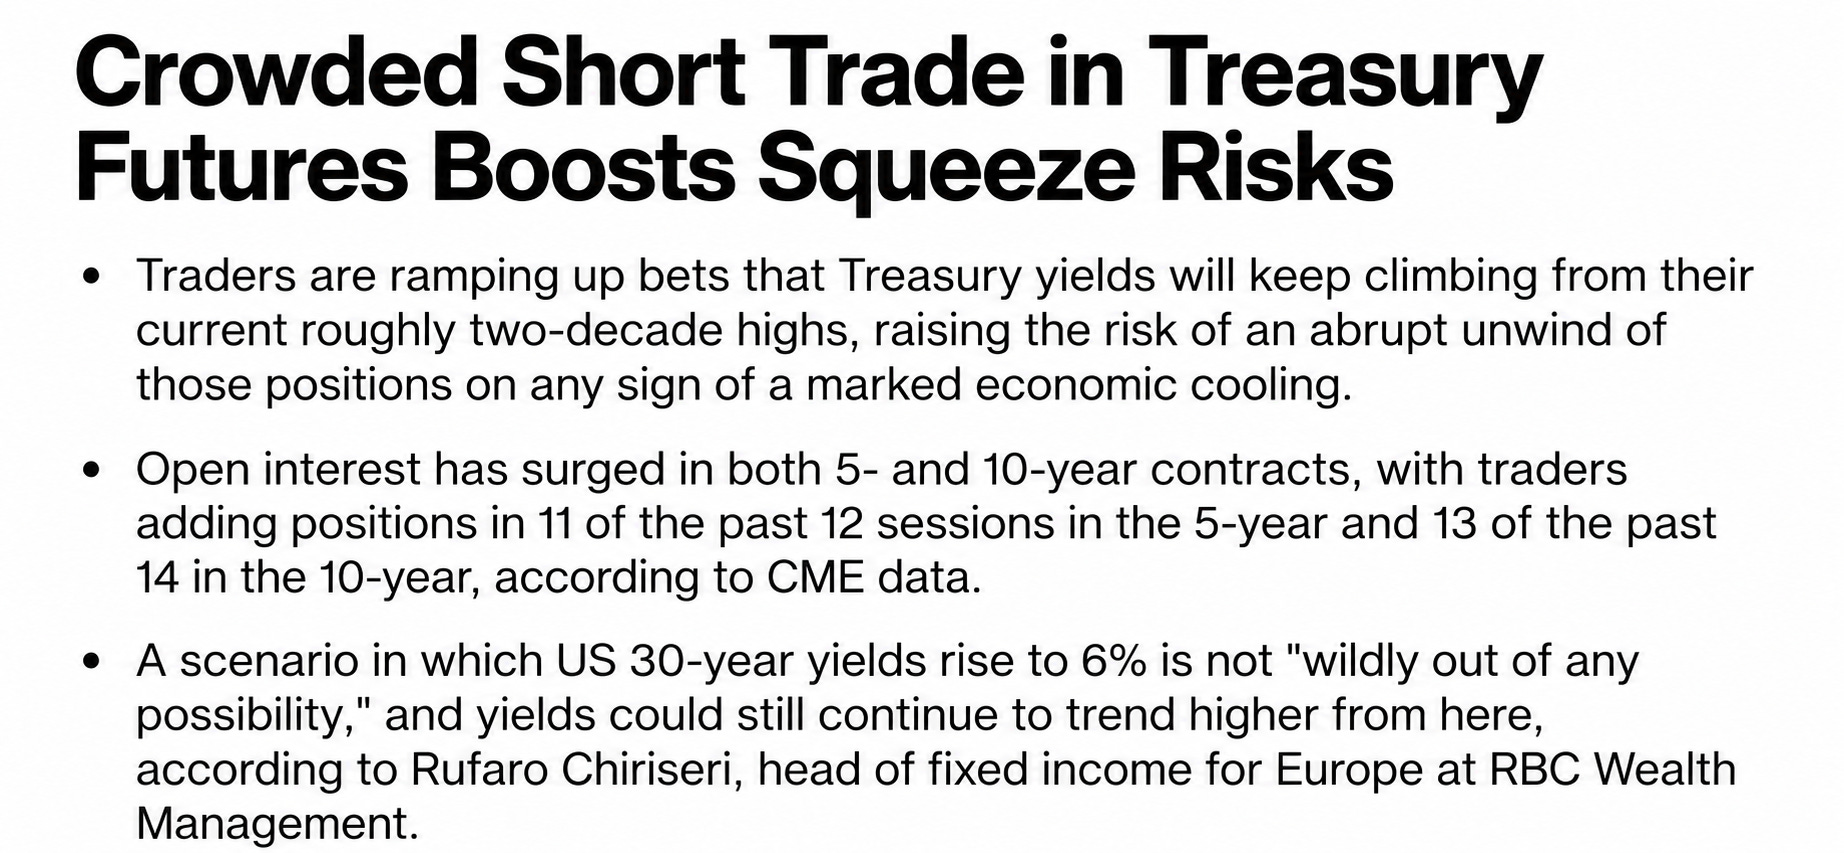
As of writing this, leveraged funds are net short about 1.9 million 10-year note futures, a position that makes money as yields rise, so clearly there’s still some life on this part of the spectrum.
We’ve covered our multi-strategy approach previously, but commodity futures are a genuinely new territory for us, where our starting arsenal is weak.
Nevertheless, with this much activity (~$350B industry AUM), we felt that it would be foolish of us to not at least try reverse engineering how the money is made here and seeing if there was anything we could run ourselves.
So today, we’re going to crack this style of trading wide-open and walk you first-hand through the nuances of the real strategies used, why it’s “easier” than you think, and why systematic commodities trading is never going away.
So, without further ado, let’s get right into it.
The data kinda sucks
The big-picture of what these funds do are pretty simple:
Commodity/future goes up on a macroeconomic driver
Buy
Macroeconomic driver changes or stops having an impact
Stop buying
So, in order to replicate that for ourselves, we first need data, and lots of it.
However, right off the bat, we ran into the major challenge that comes from working with these products.
Specifically, since futures contracts expire, you have to stitch the proper months together in order to get a clean price series to model.
The hard part is that the new contract trades at a different price than the old contract, so on the day of the switch (the “roll”), there are huge price jumps that aren’t exactly real.
For instance, let’s say Hog futures expire on October 31st and December 31st. On October 31st, that front month might be trading at $80, but the next December future might be trading at $85. A naively stitched series would show a fake 6% jump.
So, before starting any strategy work, we took some time to clean the data, which pretty much looked like this:
Dropping the junk bars, like zero-volume holiday prints and switches to the wrong contract
Manually finding each market’s roll day
Removing the gap on that day, so the series only carries returns you could’ve actually earned
To check the work, we compared the cleaned series to ETFs that hold the same thing (e.g., copper futures to CPER), and after allowing for the interest those funds earn on cash, Treasuries tracked to within 0.1% a year and most commodities to within 1% to 2%.
So, once we had the clean data engine in place, we pulled ~30 years of data for every tradeable commodity and non-index future, then got to work on finding out what made money.