

Sweetgreen reports its second quarter earnings on August 6, after the close.
For a decent slice of the buy side, that print will be a mere formality, as they’ve already watched the quarter assemble itself one card swipe at a time.
Little known to the general public, every tap of a Visa at a salad counter becomes data exhaust. The anonymized record flows out of an issuer or processor, gets tagged to a merchant, and lands in a dashboard some fund is paying handsomely to refresh.
By the time management gets on the call to explain the quarter, the sophisticated money has already traded it.
So today, we’re going to walk through how this actually works, using the best real-world example on record: two data analysts at Capital One who used the bank’s own card database to turn roughly $147,300 into $2.8 million, and got charged by the SEC for their trouble.
We’ll start with the textbook version of transaction-panel nowcasting, and by the end you’ll see how the version a real desk runs is where it gets really interesting.
So, without further ado, let’s get right into it.
Your Receipts, For Sale
A transaction panel is a sample of millions of de-identified credit and debit card accounts, sourced from issuers, processors, and financial apps.
To the fund, your $16 harvest bowl is account #8837421 spending $16 at merchant ID “SWEETGREEN #204” on a Tuesday, from an account that’s been in the panel since 2021.
The vendors packaging this are a small oligopoly: YipitData (450+ institutional clients), Consumer Edge (93M+ cards across 40K tagged merchants), Bloomberg Second Measure, and M Science. Below all of them sits the public tier, Bank of America’s aggregate card-spend data, which anyone can read.
The core pipeline for this generally flows like this:
Ingest raw transactions from the card feeds.
Tag each descriptor string to a ticker (the merchant-mapping problem, which is harder than it sounds).
Sum the matched spend for the company’s fiscal quarter.
Compare it to the same panel’s matched spend a year ago.
That YoY growth of matched spend is your revenue proxy. If the panel’s Sweetgreen spend is running -9% against last year, you have an estimate of the quarter weeks before the print.
Accuracy varies by name and desk, but a 2019 study found that card-panel based methods outperformed earnings consensus on ~57% of quarterly revenue predictions.
So, at first glance, it’s better than a coin flip, but far from a crystal ball.
Now, to see what this looks like when someone actually runs it with conviction, let’s go back in time.
Two Analysts Walk Into a Database
In January 2015, the SEC announced insider trading charges against Bonan Huang and Nan Huang, two data analysts at Capital One.
Their day job was fraud investigation. Mechanically, that job description means one thing: raw query access to the bank’s database of customer credit-card transactions.
Millions of cardholders, every swipe, updating continuously.
Somewhere along the way, they realized what they were staring at all day. Capital One’s transaction database is a transaction panel, the same asset the vendors above sell for six or seven figures a year, except theirs was enormous, clean, and free.
Per the SEC complaint, the playbook went like this:
Query the database for cardholder spend at a public company, say Chipotle, across its fiscal quarter. (They ran thousands of these searches, across 170+ publicly traded companies.)
Compare it against the same spend a year earlier. That YoY number is your revenue estimate, the same thing the street is trying to model.
Hold the estimate up against Wall Street consensus.
Panel running hot versus consensus → buy calls into the earnings print. Running cold → buy puts.
Wait for the print, collect, repeat next quarter.
Options gave them leverage, and quarterly earnings gave them a catalyst with a date stamped on it, so the account compounded violently.
Over roughly three years, they turned about $147,300 into $2.8 million for an ~1,800% return. Their single best session came in June 2014, when one Chipotle earnings surprise paid them more than $377,000 in a day (chart below).
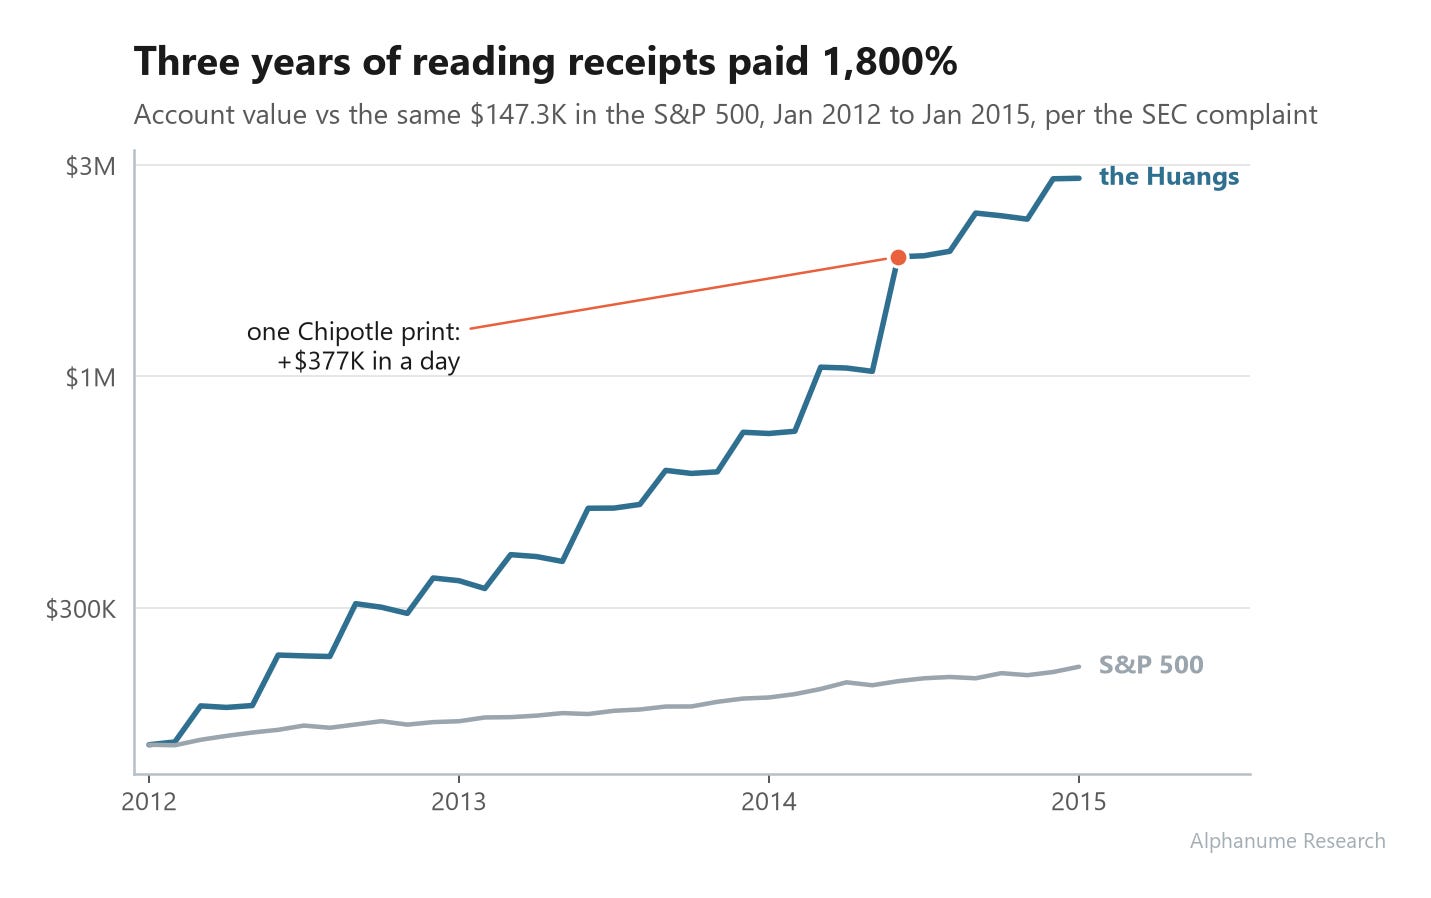
For scale, a fund that compounds at 20% a year gets a marketing deck and a waitlist, but these two were running multiples of that from a cubicle on the fraud desk.
The Only Illegal Part
At this point, you might assume the illegal part of this is using that kind of data at all.