

About a year ago, we walked through our bread-and-butter short book, showing you the nitty-gritty of share locates, basket orders, and auction mechanisms; more on that here:

To quickly recap, we essentially trained a classification model on features of microcap pre-market trading activity to isolate the names most likely to drop more than 5% intraday.
Once we have the model outputs each morning, we size an equal-weighted basket based on a % of NAV, request share locates, then submit market-on-open orders to ensure we get filled at the official opening price.
We haven’t spoken much about it since, but we’ve gotten a lot more serious about how we run this, both in terms of infrastructure and, more importantly, scale.
After all, if you have an extremely effective process but the reason you don’t make more from it is that it’s vaguely “capacity constrained”, you’re potentially leaving a lot on the table.
So today, we’re going to go deep on this and show you what it looks like to run real money behind this. We’ll cover automating the entire process (even the difficult locates), running market-impact models to find the actual amount we can scale to, and get into some live data you likely haven’t seen before.
So, without more waiting, let’s get right into it.
Scale, Scale, Scale!
My bias for seeing the strategy as ultra-low capacity was the visibly low market caps of the names (some <$10m) and the bad aftertaste of getting partial fills a few times.
However, I never did the actual math on the true volume we could theoretically move.
So, to begin, I pulled the opening-auction data for every name the dataset has flagged at $1 or more, which came out to 3,348 unique observations across 582 sessions, since May 2024:
The median name clears just $73k in its opening auction
The bottom 10% clear $8k or less
For the median name, the auction is only about 0.4% of the day’s regular-session volume
A typical morning’s whole basket (about 5 names) clears around $670k combined
Surprisingly, the numbers got a lot more interesting when I split up the names by auction size and looked at how they performed:
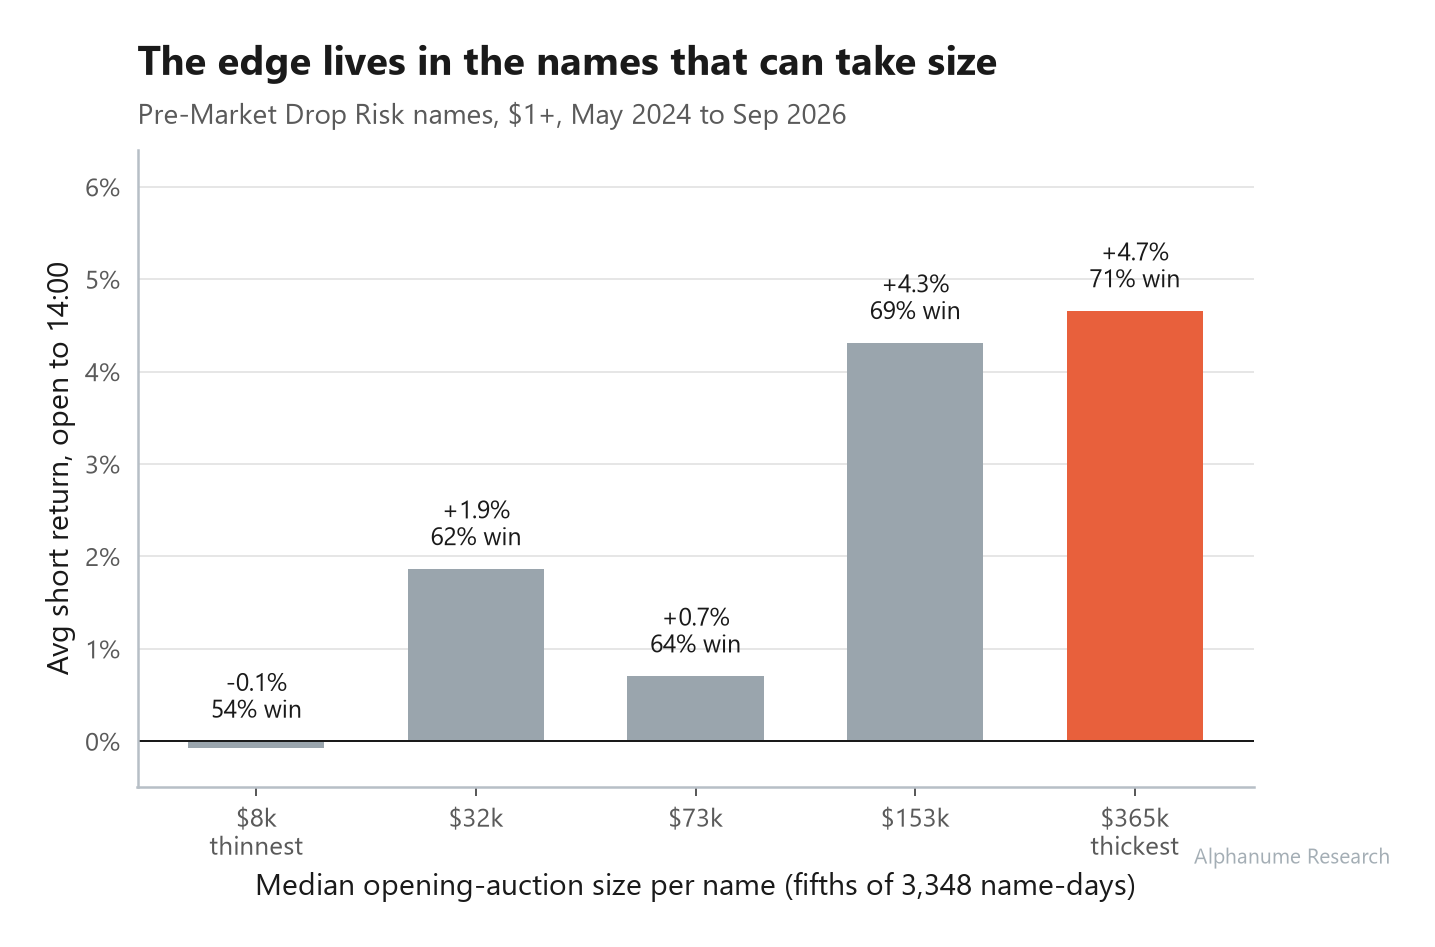
The smallest 20% of names averaged about zero, while the largest 20% averaged +4.7% per trade with a 71% hit rate, so even with a bumpy middle, the names that can hold size are also the ones that have the most edge.
Capacity Modeling 101
Knowing how big each auction is gives us a helpful start, but we still have a bit more work to do to get a usable number.
To get that number, I replayed the live strategy (short at the open, cover at 14:00) over every session in the dataset, with a few realistic limits. Namely, a participation cap that assumes our size can only be at most 10% of each name’s opening auction.
We’ll also use a standard square-root impact model on both legs, which basically charges more the bigger you are relative to the day’s volume.
Given what we found regarding auction performance, I tested two ways of splitting up the order sizes:
Equal weight, which is what the live program does today, where every name gets the same slice of the day’s budget.
Sized by auction, where each name’s slice is proportional to its opening-auction size, so the bigger auctions take more of the money.
For instance, say you have $30k to short across three names:
Name A: $20k auction, so at most $2k fits (the 10% cap)
Name B: $100k auction, so at most $10k fits
Name C: $180k auction, so at most $18k fits
Equal weight gives each name $10k:
A only takes $2k, so $8k goes unused
B takes the full $10k
C takes the full $10k, even though it had room for $18k
$22k filled (73%)
Sizing by auction splits the $30k in proportion to each auction’s size (20 : 100 : 180):
A gets $2k, B gets $10k, C gets $18k
Every order fits, so $30k filled (100%)
Running that same comparison across every session gives us the graph below:
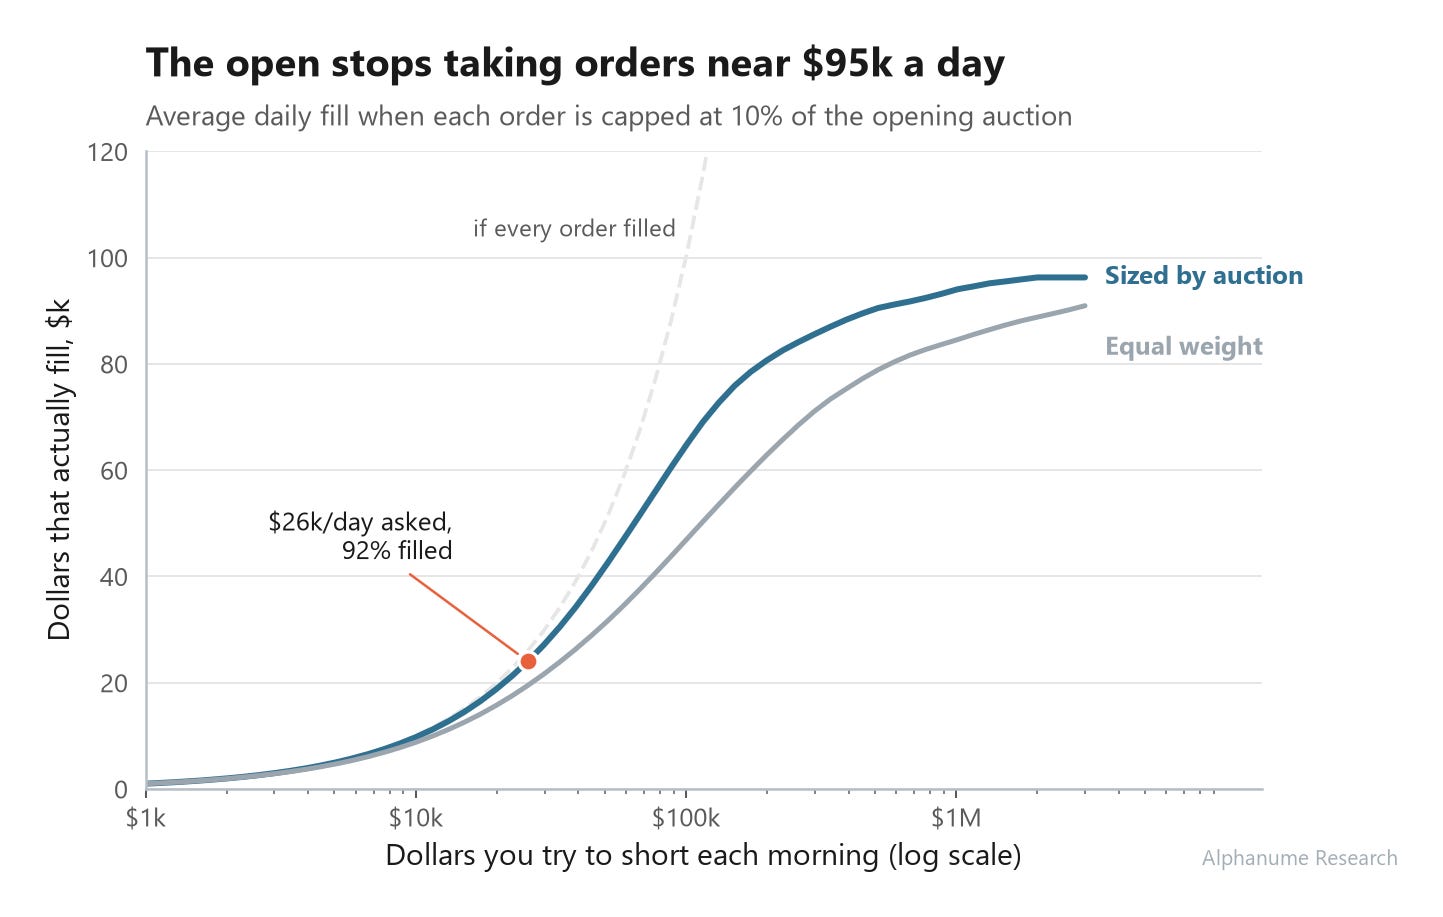
A quick guide on reading this:
The bottom axis is how much you try to short each morning, where each step to the right is 10x bigger
The side axis is how much you actually get on an average day
The dashed line is the dream scenario, where every dollar you ask for fills
At small sizes (e.g., <$10k), you basically get everything you ask for, but as demonstrated, the auctions simply start running out of room the bigger you get.
If we were to stick to the equal-weight approach, we’d be getting less than 90% of what we ask for once we hit ~$9k a day.
However, if we size by auction, we’d get filled 92% of the time once we hit ~$26k a day.
Eventually, both hit a cap at ~$95k a day, which looks the true capacity limit of the strategy.
It’s still small relative to major index strategies, but at least we have a real number to work from and not just “it’s low-capacity”.
The Real Life Version
To see how this works in practice, let’s walk through this morning’s real basket, where one of the names fell over 60% before we covered it.
At ~09:08, the dataset returned four names priced at $1 or more. MSGY came in ranked second with a 0.695 probability of dropping, after running +320% over the prior five days on a stock that was down 94% over the past year.
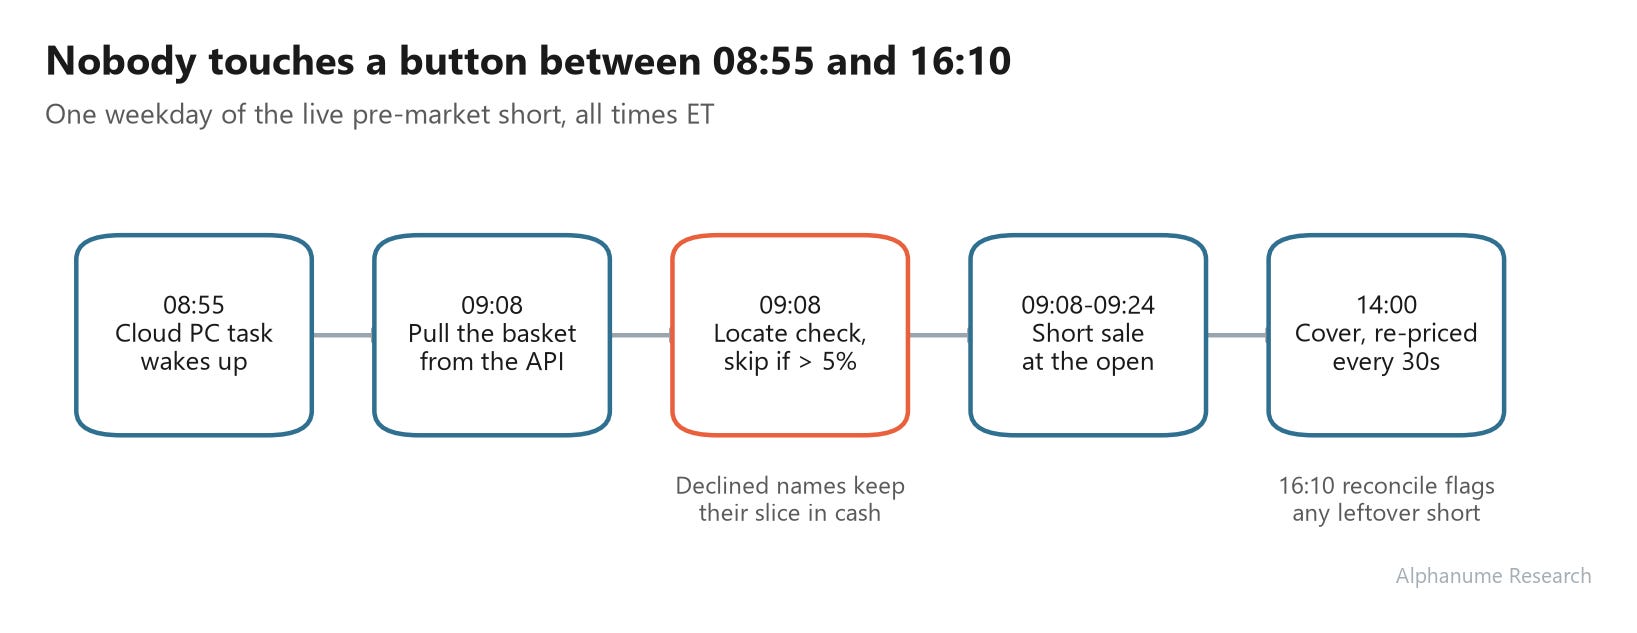
It’s definitely not state of the art, but we run this on a Windows Cloud PC (basically a Windows desktop that lives in Microsoft’s data center and never sleeps) with two scheduled tasks that manage the orders and locates, with backup triggers and retries so a missed start or a crash doesn’t cost us the day (diagram below):
Some data from today’s real execution:
Locates
The program asked TradeZero for locate quotes on all four names and declined LABT, whose fee came in at $0.125 a share, above our 5% of notional cap.
Entries
The other three went into the opening auction as market-on-open short sales, and MSGY filled at $8.25 (the “official” open price)
Exits
At 14:00 (2PM EST), the program placed buy-to-cover limits at the ask, re-pricing every 30 seconds, and all three filled within about a minute.
TradeZero’s API doesn’t accept market-on-close orders, unfortunately
PnL:
MSGY: shorted at $8.25, covered at $3.08, +62.7%
PMAX: shorted at $1.77, covered at $1.37, +22.6%
GYGY: shorted at $1.23, covered at $0.97, +21.3%
This came out to an average of about +35% across the three, with locates costing between 0.7% and 2% of each name’s price (LABT, the one we passed on, was also down about 34% by midday).
I was curious about how much extra size we could’ve added, so taking the math from above, I re-ran today’s numbers. With our assumed 10% cap of auction volume, that gives us:
MSGY: a $77k auction, so we could short about $7.7k
PMAX: a $21k auction, so about $2.1k
GYGY: a $653k auction, so about $65k
At full capacity, that comes out to about $75k across the three names, which is a bit under the ~$95k average ceiling, though still more than I’d have guessed.
Running it yourself
Everything the program trades comes from Alphanume’s Pre-Market Drop Risk dataset, which publishes around 09:08 ET each morning, with history going back to May 2024.
Each row gives you the model’s prob_drop, the day’s rank_for_date, and the last pre-market price. After the close, it adds the actual intraday return, so you can reconcile every output yourself.
It’s included in Alphanume Pro, along with the REST API, the hosted MCP server, and live-trading rights. As such, replicating this is pretty simple:
Pull
GET /v1/premarket-drop-risk?date=YYYY-MM-DD&min_price=1from about 09:08Size each name by its pre-market dollar volume, capped at a small slice of its typical opening auction
In practice, you won't know the size of today's auction at 09:08, so the live version uses pre-market dollar volume as a stand-in, which tracks auction size closely and performs about the same in the model.
Quote locates and only accept the ones under your cost cap (e.g., <5% of position notional)
Send market-on-open short sales before about 09:25
Cover at 14:00 with limits at the ask, re-pricing until filled
Schedule both jobs on a machine/server that never sleeps
Final Thoughts
Although this strategy isn’t new to us, we never took the time to actually build out a market impact model to know how much we were really able to scale up to.
The first obvious change on our end is looking deeper at the auction and imbalances themselves as potentially new features, since they consistently mapped to higher short returns over the sample (t-stat of ~3.2).
As stated before, I genuinely don’t expect this specific approach to stop working anytime soon (no matter how many people read this), as the adverse selection of the pool being an illiquid, low-quality segment just lends itself to negative forward returns. For it to stop, you’d have to come up with a pretty good reason for why large chunks of the market would suddenly want long exposure to these toxic names.
I hope that by the end of this, you were able to get a sense of what it looks like to find the true capacity of a trade, and in the best case, were inspired enough to pull the data to replicate and re-work what we found.
As always, thanks for reading, and we’ll see you in the next one.