

Today, as of writing, the S&P 500 ETF fell 4.4%, the Nasdaq-100 fell 6.4%, and the semiconductor ETF lost 11.5% in a single session (the sell-off was led by chips).
The same day, a letter from Walleye Capital started making the rounds, and the news was rough. In sum, the ~$17 billion multi-manager had its worst month since 2020.
In response, it’s removing the head of its equity L/S business, cutting a big chunk of those teams, and handing some capital back to investors. But before that news came out, my timeline (and probably yours too) was awash with these:

A broken clock is right twice a day however, and for once, it seems there’s substantive evidence that a trading desk (or multiple) actually “blew up” this week.
Every equity pod on the Street is technically “market-neutral”, and yet you’ll keep seeing this same story over and over again.
So today, we’ll reconstruct one of the core trades sitting inside most equity pods, then use real data to see how it’s performed. By the end, you’ll not only learn how some of these strategies operate, but you’ll also see that this time, they really did blow up.
So, without further ado, let’s get started.
What On Earth Is a “Pod” anyway?
To start, let’s say we wanted to understand what a “fundamental equity pod” was. At a high level, the structure typically goes as follows:
A portfolio manager (PM) and a few analysts, each covering a sector, picking longs they like and shorts they don’t.
The ultimate portfolio aims to be roughly dollar-neutral and beta-neutral, so the returns of the book are independent of a broad index
The same thing applies to sectors, so long semis might be paired with short semis, long banks with short banks, and so on.
Lots of leverage, since the hedged book has “very little” risk left, and for this experiment, we’ll assume 6x gross (300% long, 300% short) as a typical number.
On the risk front, hard stops are commonplace; the rule of thumb rumored for the big platforms is that a PM who’s down about 5% gets their capital cut in half, and one who’s down about 7.5% is likely to be let go.
The risk team’s job is basically to strip out every exposure that isn’t the PM’s stock-picking skill, so whatever’s left over is supposed to be pure “alpha”.
In practice though, a risk model can often call a book neutral when it’s long the stocks that have gone up the most and short the ones that have gone down the most, as long as both sides have similar betas and sit in the same sectors.
That leftover tilt is often called momentum, which is essentially a bet that the past year’s winners keep beating the past year’s losers.
Momentum… It’s Always Momentum.
Now, AQR publishes daily returns for the classic equity factors going back to the 1920s, including their momentum factor, UMD (up-minus-down).
The problem is that their files currently stop at ~August 31, which is over 2 months old by now.
So, to show you how these trades are typically structured, I rebuilt the factor myself:
I pulled daily closes for every US stock from Massive, going back to January 2024.
At each month-end, I took the 1,000 largest names trading above $5, using point-in-time market caps from Alphanume, so there’s no survivorship bias in the universe.
I ranked each stock on its 12-month return (skipping the most recent month), within its sector.
I went long the top 20% and short the bottom 20% in every sector, $1 on each side, and rebalanced monthly.
Finally, I hedged out the leftover market beta using the spread’s trailing 60-day beta to SPY.
By the end, this represents a sector-neutral, dollar-neutral, beta-neutral momentum spread, which is what a lot of trading risk models would call “market neutral” because, again, it technically is.
Now, a homemade factor is only worth using if it matches the real one, so before running it past August, I lined the unhedged version up against AQR’s UMD over the 19 months where both exist, and the daily correlation came out at 0.94.
So, our in-house version tracks the real factor closely enough to start getting into the results:
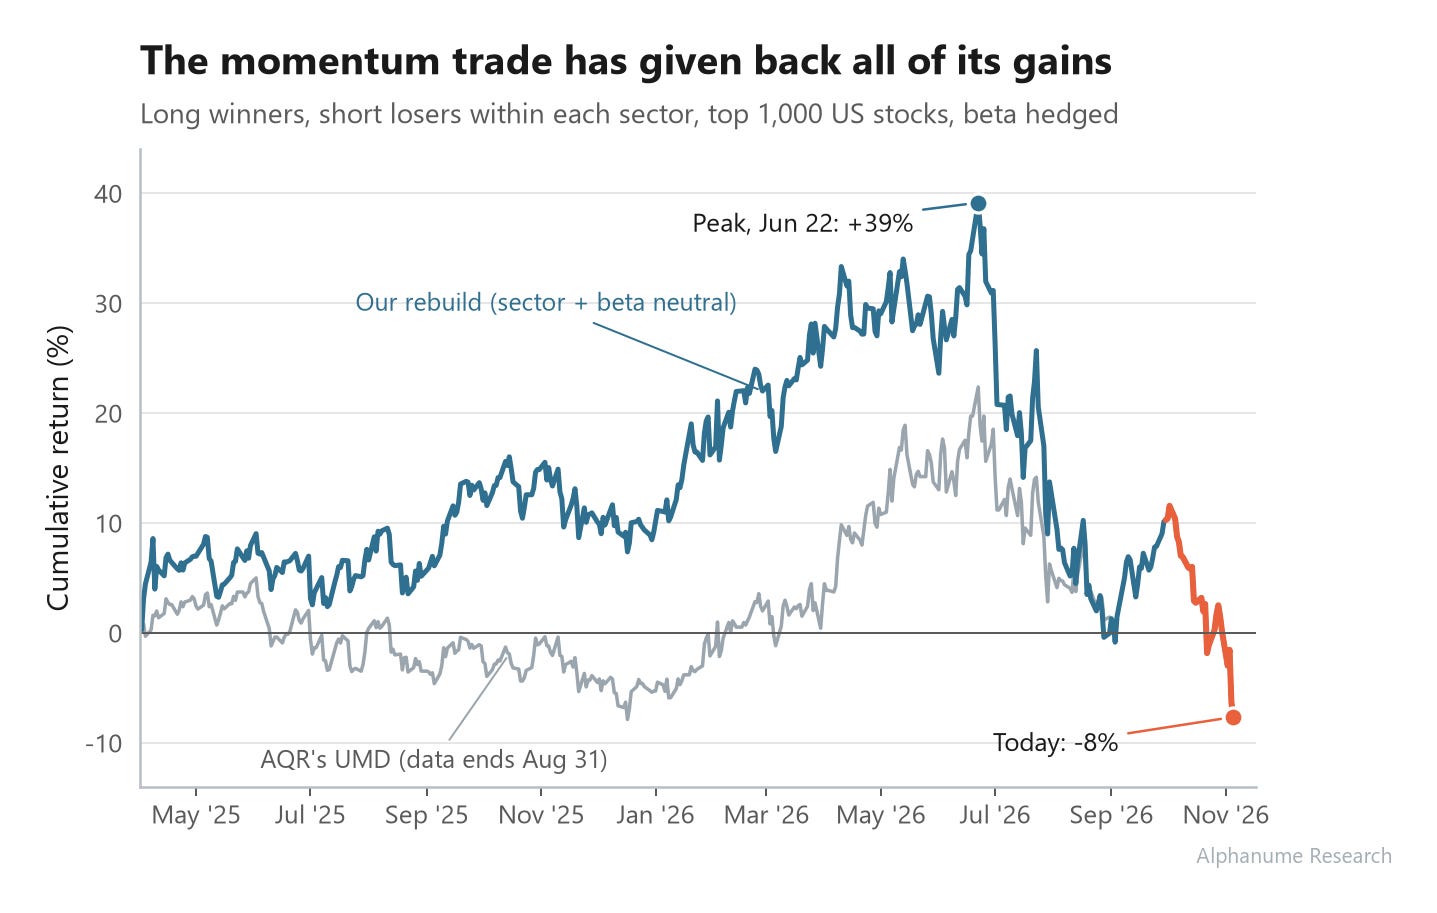
So, right off the bat, it’s the same story you likely already know: you were a genius if you bought AI winners and sold the laggards. However, as demonstrated, everything seemed to unwind violently and all at once, so that’s where we want to focus.
To understand why it all went wrong so quickly, we have to look at how leverage becomes toxic when factors simply stop working.