Imagine you’re a power trader in California.
It’s a sunny Tuesday in May, your desk has had a slow month, and PnL reviews are coming up.
So, you get an idea.
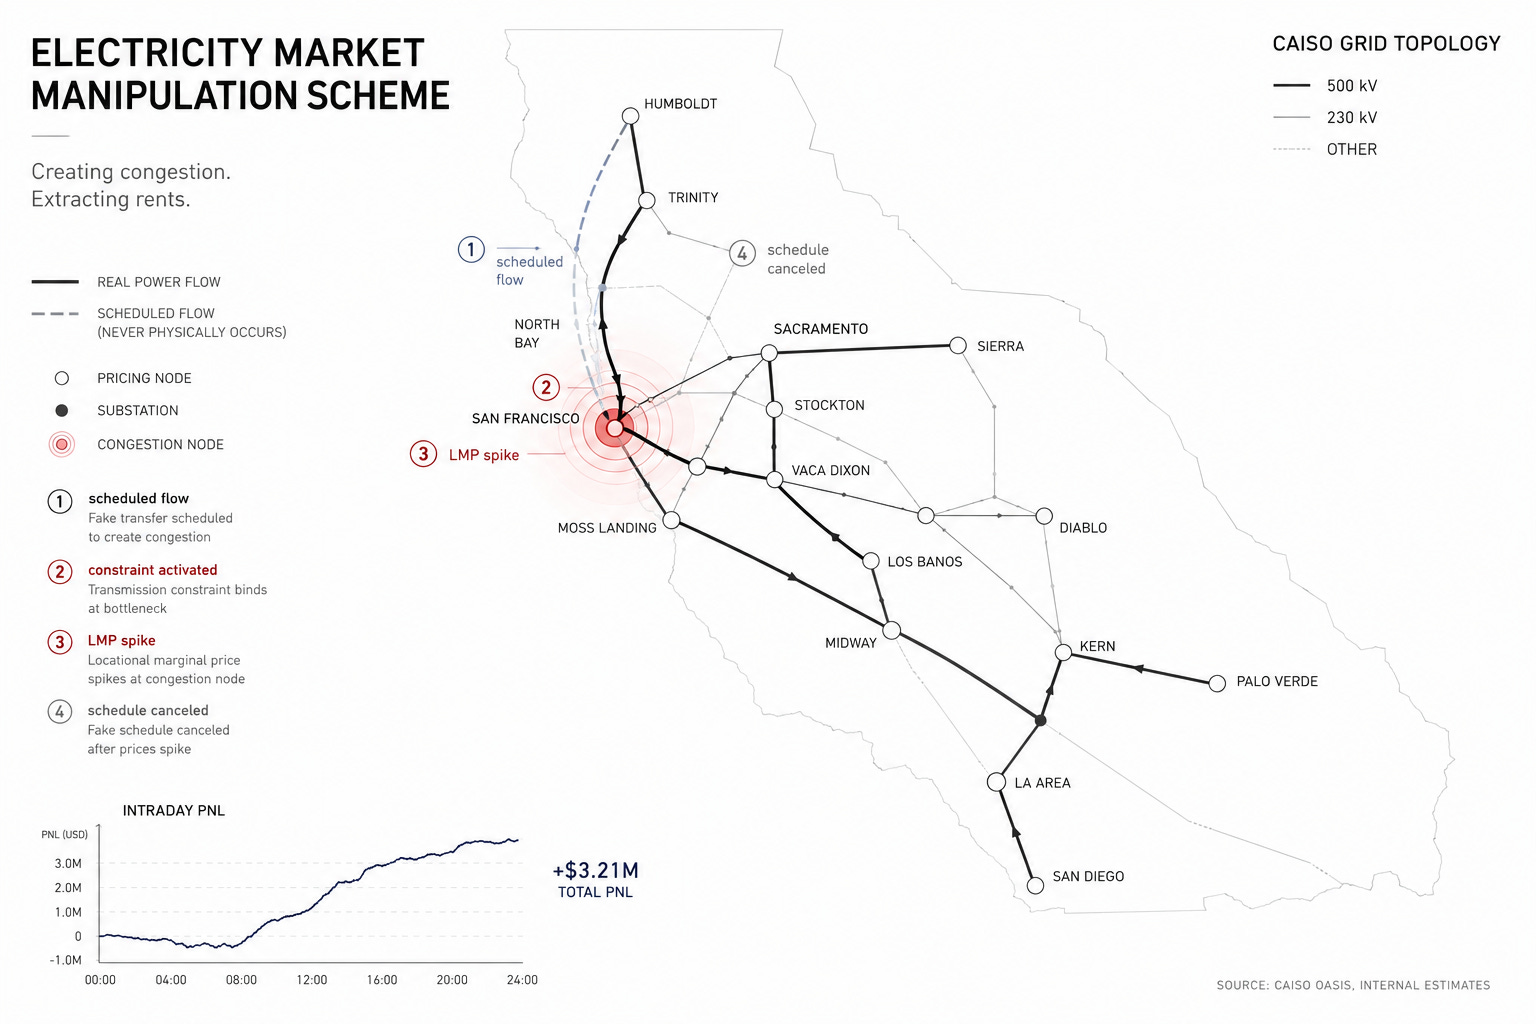
First, you buy a large financial position tied to the price of electricity at a specific pricing node near San Francisco. The position pays out if prices at that node spike.
Then, you call your scheduling desk and have them submit an order that routes power across a node you know is already congested. You have no intention of actually delivering the power, you just want it on the schedule.
The grid operator’s algorithm sees your scheduled flow, recognizes that the line is now over capacity, and pays you to relieve the congestion by canceling the schedule you never planned to use. Meanwhile, the local price at your node spikes because the grid is now treating your fake demand as a real constraint.
You sell the position into the spike.
An hour later, the schedule is canceled, the price normalizes, and you go back to your coffee.
That trade is called the Death Star. Enron’s West Coast power desk ran it dozens of times in 2000 and 2001 and the transcripts of the traders laughing about it are still public.
If you’re reading this, you probably already know about the typical stocks, bonds, options, and futures.
You may even read publications that cover them with math and models.
What you may not know is that the some of the most lucrative quantitative trading in the United States is not happening in NYC. It’s happening in Houston, Portland, Calgary, and on trading floors most quants have never even heard of.
Electricity trading is one of the most actively traded commodity markets in the world. It has its own derivatives complex, settlement quirks, latency games, and alt-data ecosystem.
So, today, we’re going to be taking a good look at the fascinating overlap between quantitative trading and power markets.
You’ll see not just how they’re so profitable and predictable, but you’ll also walk away with an understanding of an entirely new asset class that you might not even have known existed.
How Does This Stuff Even Work?
Electricity markets are strange because electricity has to be used almost immediately after it’s produced.
You can store small amounts in batteries, but for the most part, the grid works like a giant live balancing act:
Too little power → blackouts
Too much power → equipment damage
So every second of the day, grid operators are trying to keep production and consumption in balance.
Pretty simple.
The interesting, and more importantly, tradeable part is that electricity is not priced uniformly across a region.
Power in one part of California can become extremely cheap while power in another part becomes extremely expensive, sometimes within the same few minutes.
This is largely because electricity still has to move through physical transmission lines with genuine limitations.
It helps to imagine a highway during rush hour: if everyone wants to drive into San Francisco at the same time, traffic backs up and the “cost” of moving through the system rises.
If too much power tries to move through a clogged line, the grid operator has to start rerouting flows, turning generators on and off, and changing prices to relieve the congestion.
So, the core question among traders in this market is:
“Can you predict where the grid is going to become stressed before it happens?”
Turns out, you absolutely can.
How Does Anyone Actually Make Money Here?
Most trading in this space happens through something known as an FTR (Financial Transmission Right), which is basically just a contract that pays out based on the difference in price between two locations.
To see this, let’s take two points:
The Texas Panhandle: A windy region with massive wind farms that generate and send power outward
Dallas, Texas: A major city with huge power demand for offices and homes.
On a windy day, the price in the Panhandle collapses as the wind farms produce more than the grid can move out. So the price there might be $1.50 per megawatt-hour, while the local price in Dallas might be $2.50, creating a spread of $1.
One day later, when there isn’t much wind at all, the price in the Panhandle might be $2, while the price in Dallas stayed the same, so the spread now is just $0.50.
The value of that spread is what gets traded.
So, the desk starts asking another simple question:
“How large will that price gap become next week?”
Now the operation turns into a forecasting problem and the trading team begins collecting inputs that might influence the spread:
weather forecasts
temperature forecasts
expected wind production
historical congestion patterns
scheduled infrastructure outages
regional demand forecasts
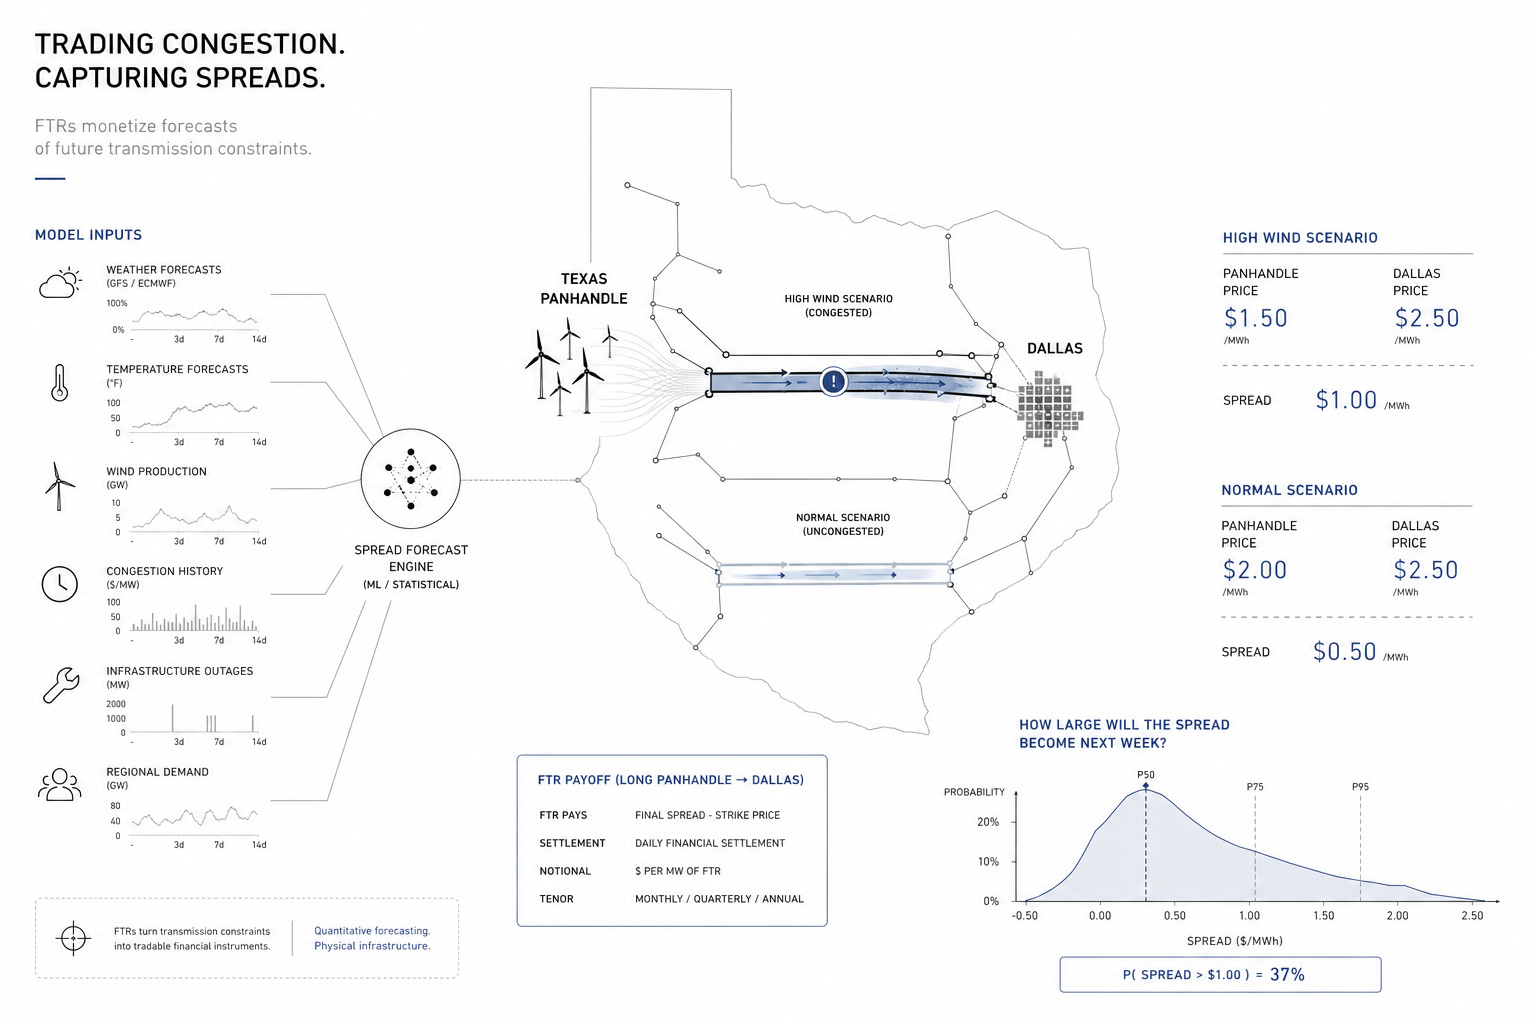
The trading team then feeds those inputs into a model that predicts the average price spread between the Panhandle and Dallas over the next month.
The training data is typically several years of historical spreads at the same two locations, paired with the above features as they were known at the time.
If the model predicts next month’s average spread will be materially larger than what the market is currently implying, the desk buys the contract and profits if that forecast ends up being correct.
Run that across dozens of contract pairs every month, across multiple regional markets, and you start to see why these desks exist.
Not Exactly Free Money
At first glance, the whole thing can look almost too predictable. Electricity has to clear in real time, so once the grid becomes stressed, prices eventually normalize as supply and demand rebalance.
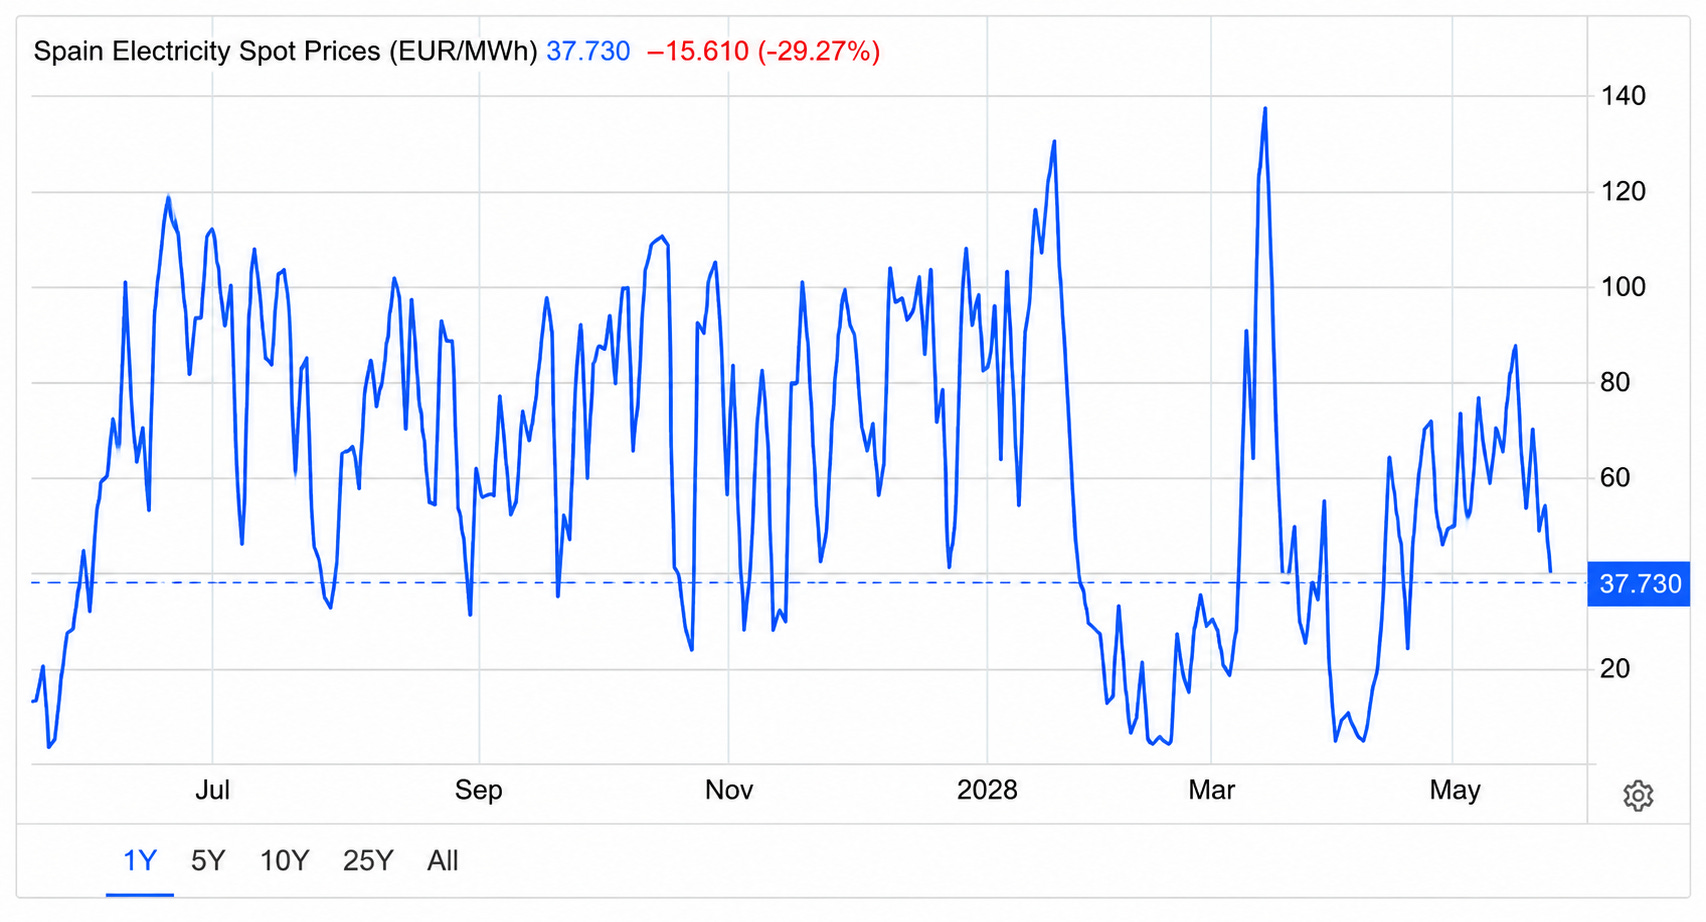
You wouldn’t be totally wrong to think that, after all, just take a look at the spot electricity price in Spain over the past year.