

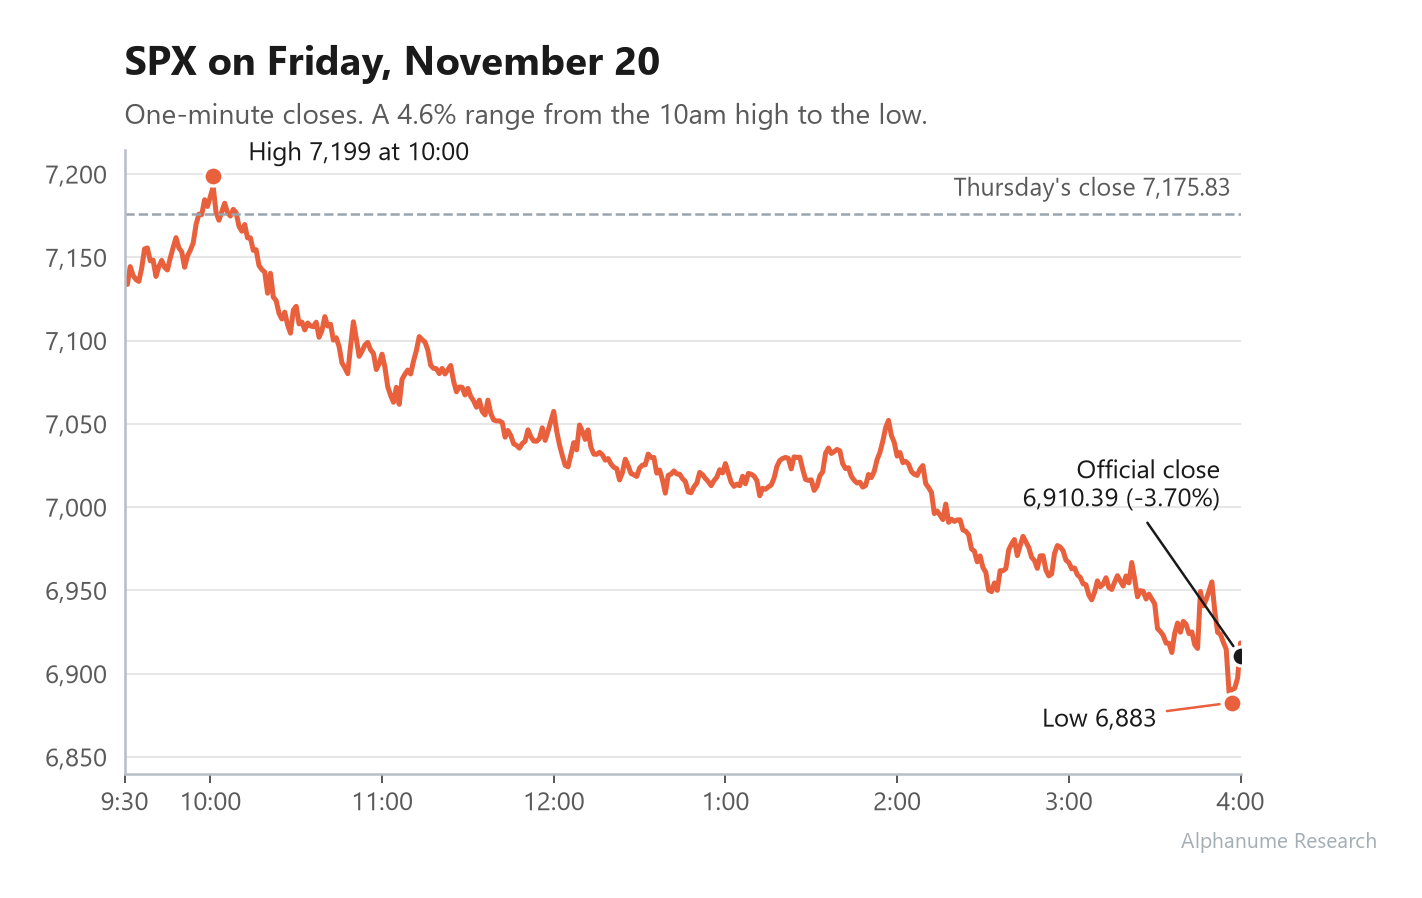
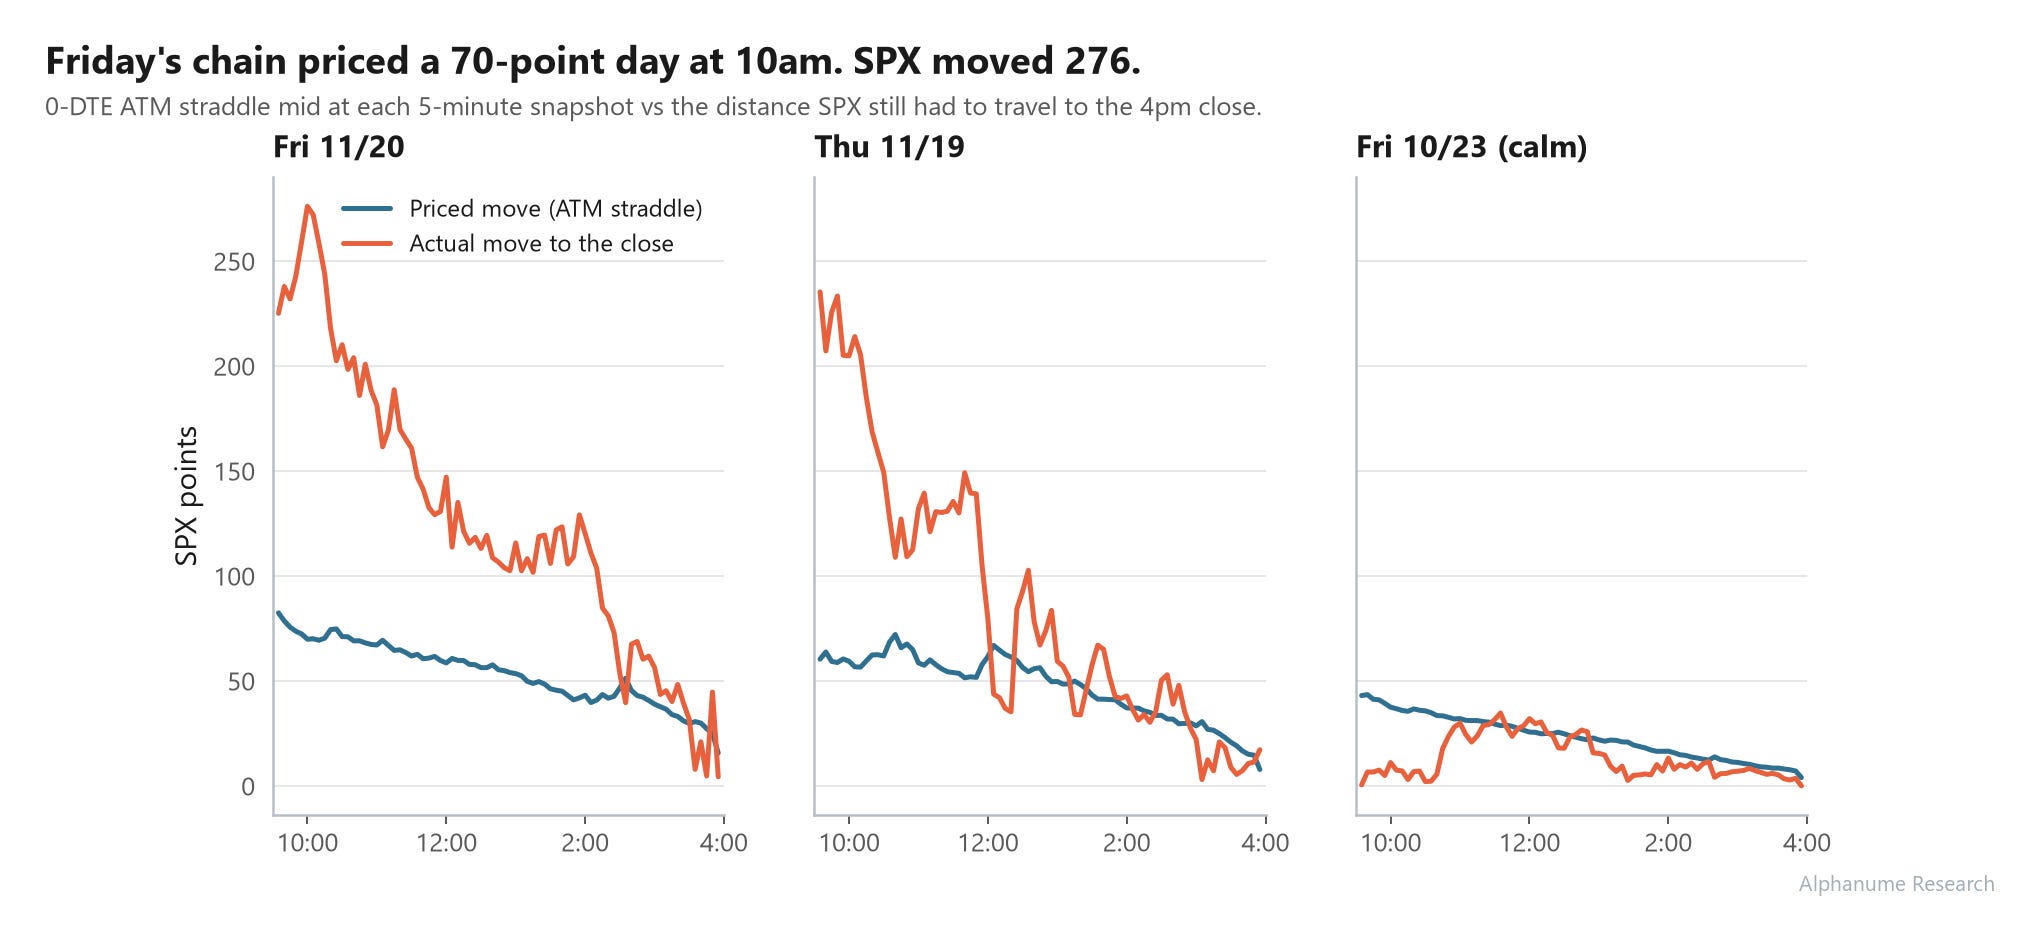
At 10am on Friday, SPX options implied the S&P would move about 70 points for the day, but by market close, it moved by 276, nearly 4x the implied vol.
The index fell ~4% as the AI selloff picked up speed, and closing more than 10% below its October record put it officially in a correction.
If you’ve been reading our work for a while, you know we’ve spent a lot of time inside 0-DTE data. We last took a deep look at 2.7 million retail 0-DTE trades which demonstrated that option spread sellers actually made money most of the time, but not a single day in that sample was like Friday’s.
It’s a post-mortem view, but I was curious about what 0-DTE and its traders tend to do on days of actual capitulation to see if there were any systematic effects we could later predict, or at the very least understand what typically happens when things go this wrong.
To figure this out, I pulled every trade, quote, and vol surface I could get my hands on to re-construct the entire meltdown from an options-first perspective.
As you’ll see shortly, it was nothing short of madness, but it’ll make more and more sense why everyone keeps going back to 0-DTEs over and over again.
So, with that said, let’s get started.
Context
There’s going to be a lot of cool-looking graphs in this one, so it’d help to lay some context on what underlying data we used for this first:
Every SPXW option expiring Friday within 9% of the opening price, with its NBBO bid and ask every 5 minutes from 9:35 to 3:59. This came out to roughly 38,500 snapshots for Friday alone.
Every SPXW trade, for every contract expiring Friday. This one came to ~1.8 million trades covering 4.1 million contracts.
So that we’re not just looking at one day in isolation, we also pulled the same data for Thursday (the day prior), and for Friday, October 23rd, as a low-volatility control.
Throughout the post, I’ll lean on the at-the-money straddle, which is essentially the chain’s guess at how far SPX travels by 4pm.
Now, Friday was also the monthly options expiration (OPEX), but the big AM-settled monthlies settled at open, so everything here is the PM-settled SPXW dailies, which settle on the 4pm close.
10am: “vol might be high today, probably.”
At 10:00, SPX was around its high of the day, and the 0-DTE straddle cost about $70, which implies the options chain expected SPX to finish roughly ±70 points from its current value.
On our quiet October control day, the same straddle cost ~$37.50 at 10am, so this was already nearly 2x higher.
Still though, it wasn’t close to enough:
Friday, 10am: implied move of 70 points, realized of 276
Thursday, 10am (day before): implied move of 59 points, realized of 205
Quiet October Friday, 10am (control): implied move 38 points, realized of 11
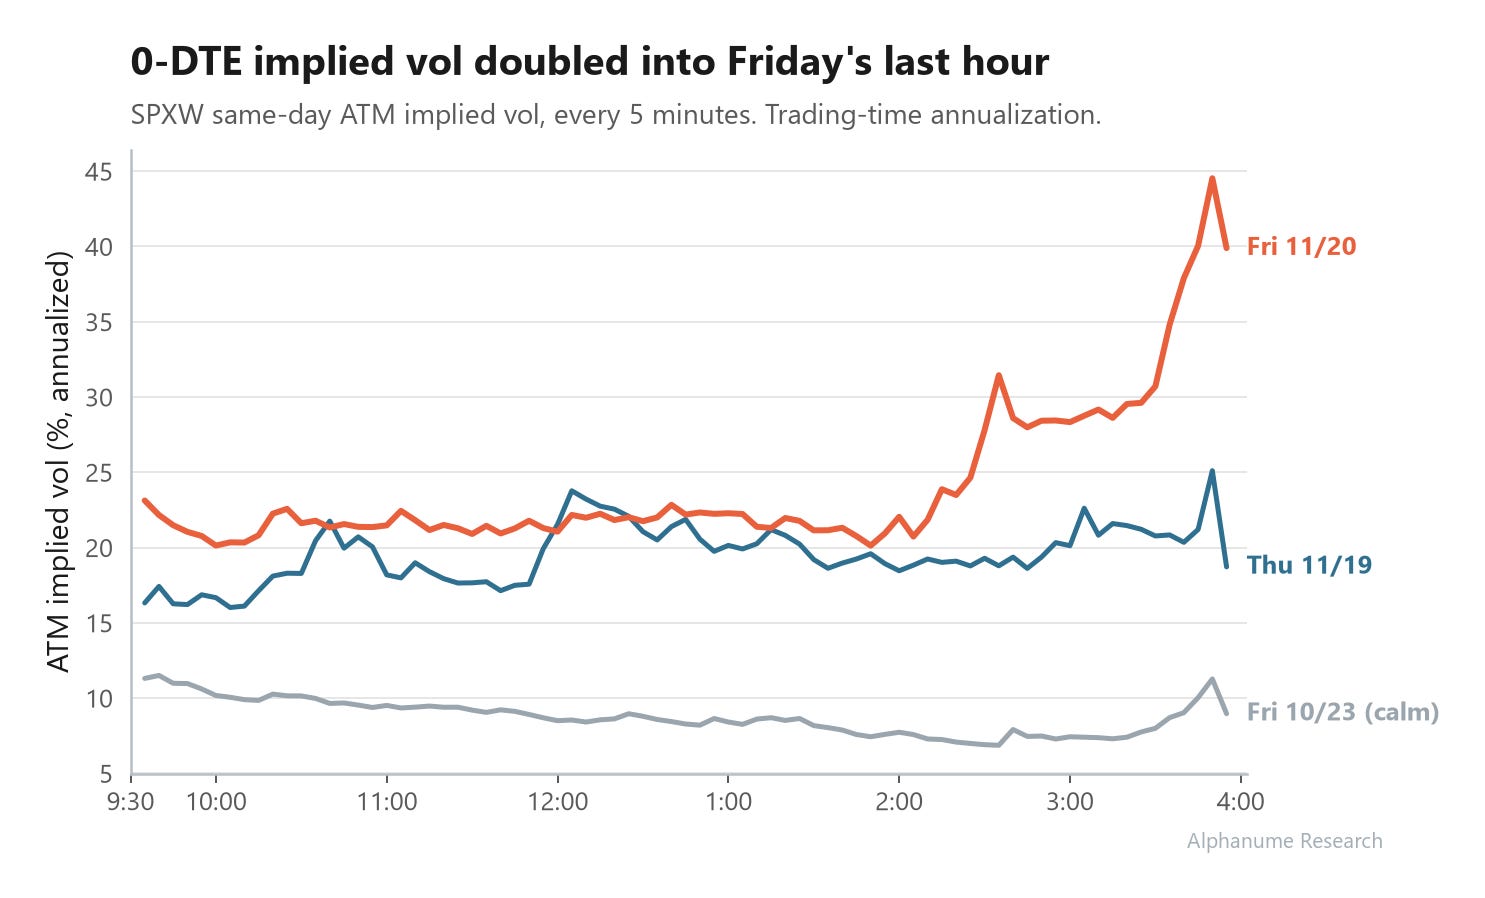
What’s interesting is that vol is well-known to be autoregressive (i.e., “if vol_yesterday = high, vol_today = probably_high”), but despite having a fresh “warning” from missing by 3.5x on the day prior, implied vol only opened up marginally higher.
10am to 11:30: “it’s probably just a fluke.”
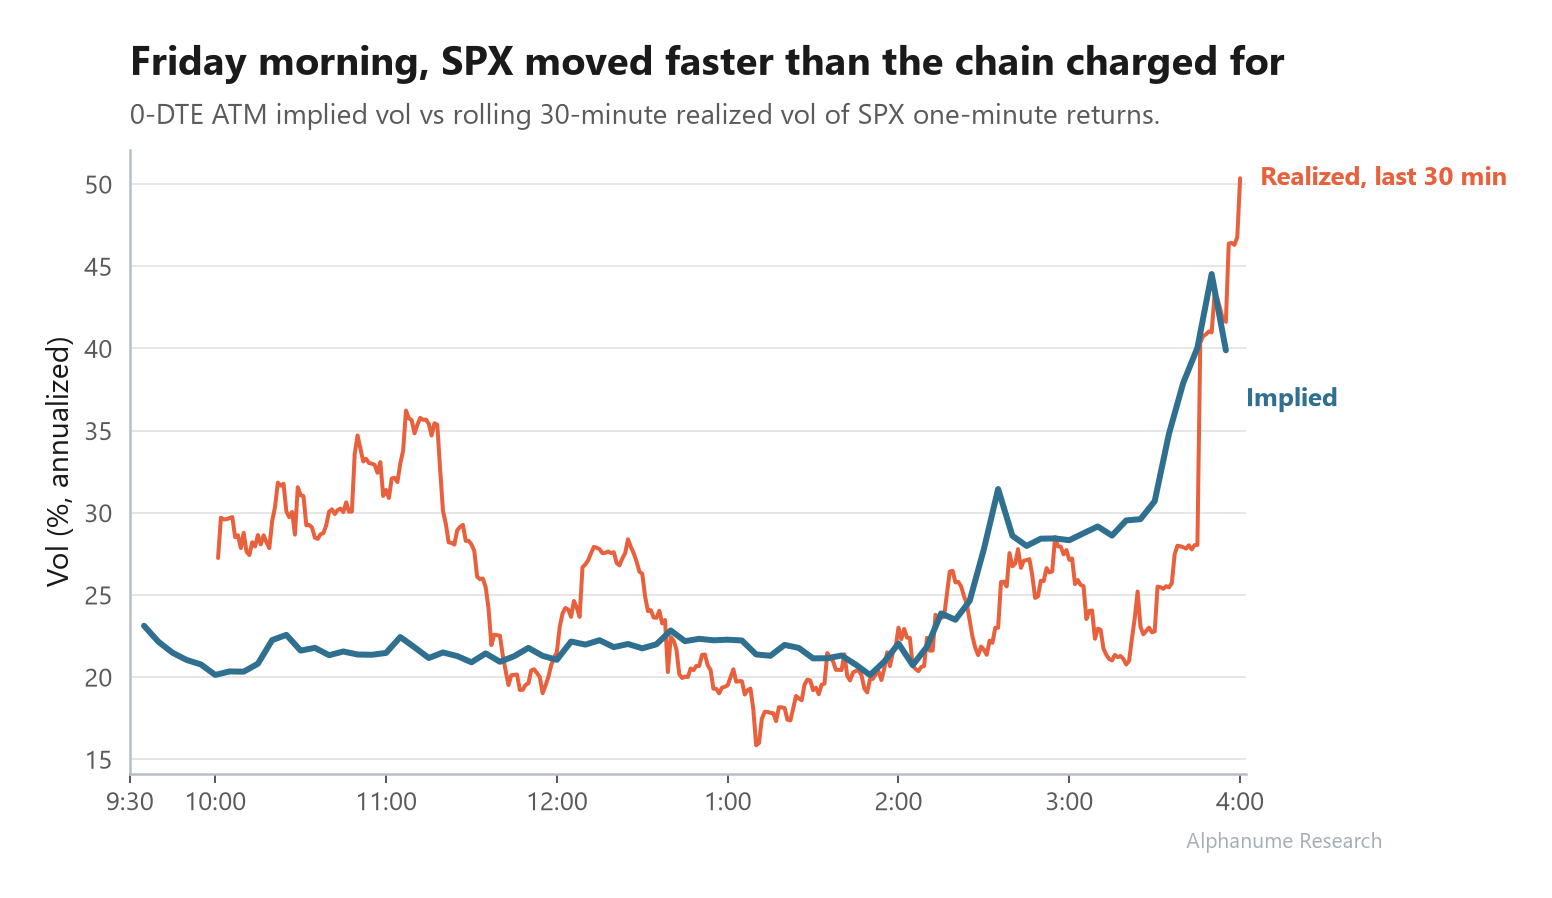
For the first 90 minutes after its high, SPX fell rapidly, but implied vol didn’t move at all.
To see this, I measured how fast SPX was actually moving, which is basically realized vol over the last 30 one-minute returns, and scaled to the same annualized units as implied vol so the two can be compared:
At-the-money implied vol sat at about 21% the whole morning
Realized vol ran between 27% and 36% from 10:00 to 11:30
So, for an hour and a half, anyone who bought an ATM straddle was making a significantly +EV bet.
Noon: “okay, this one might be real.”
Now, you’d expect the downside puts to get bid up as the market falls, but on Friday they pretty much didn’t, at least not until the afternoon.
Taking the implied vol on a put about 2% below the forward price (a good proxy for how “fear” is priced), it went as follows:
10:00: 23.5%
12:00: 24.8%
2:00: 28.3%
3:30: 50.3%
So, from 10am to 2pm, with SPX already about 170 points off its high, the smile, which is basically the curve of implied vol across strikes, again only crept up marginally.
After 2 though, people began to take things more seriously:
2pm: “it’s so, so over.”
At 2:05, ATM implied vol was 20.7%, by 2:30 it was 27.8%, and by 3:50 it hit 44.5%:
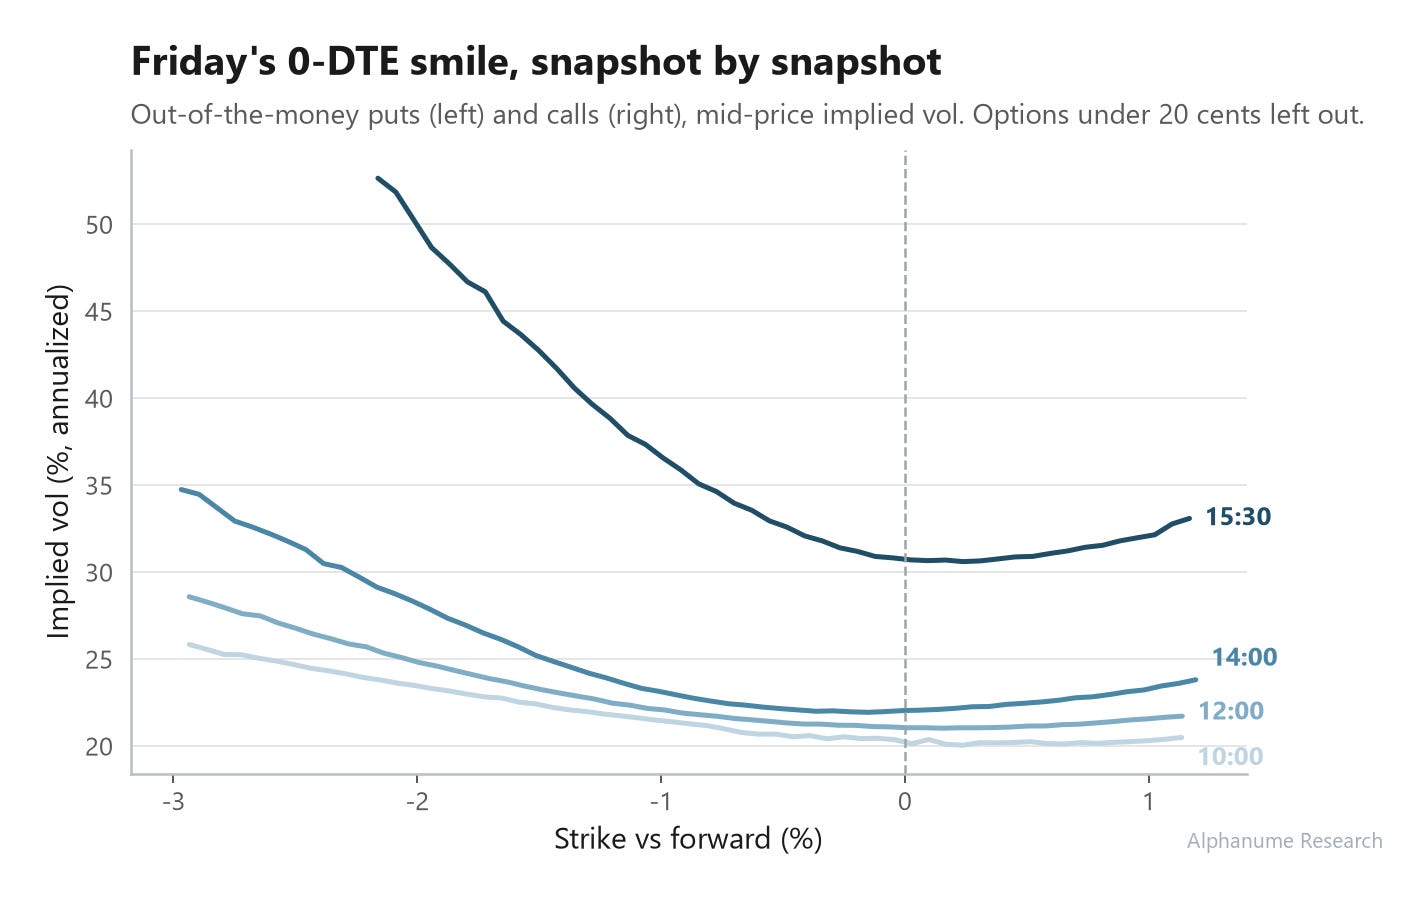
Put clearly, that’s implied vol more than doubling in under two hours, after most of the damage was already done (SPX was down ~3.4% from its high by the time vol peaked).
4pm: “everyone wins at some point.”
So, now for the fun part, which is what happened if you bought a put at 10am, right at the top of the day, and held it to settlement:
The best ticket was the 6990 put, which cost $1.50 and settled at $79.61, about 53x
Every strike from 6950 to 7040 returned 38x or better
Every put at 6910 or lower expired worthless
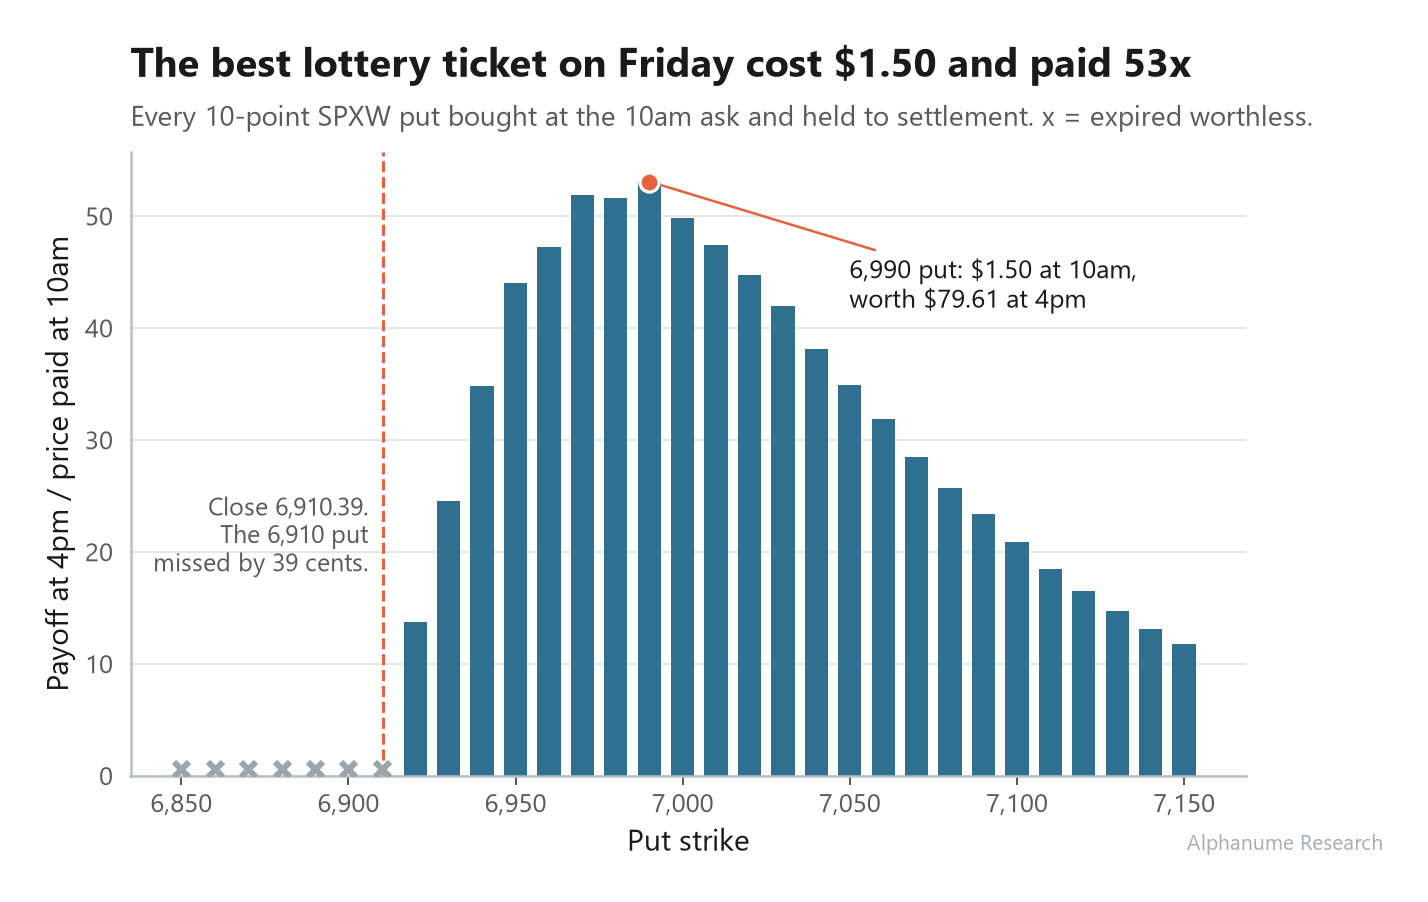
Surprisingly (or not), the cheapest puts on the board, the 10¢ puts people buy as lottery tickets, all expired worthless. At 10am, the only puts offered for a dime or less were at 6620 and below, almost 8% under the market, but SPX never got there.
The real payout went to puts that cost $0.90 to $3.40, which is basically the boring middle of the chain.
A really interesting case was the 6910 put, which cost $0.60 at 10am, did 45x, but somehow still expired worthless:
At 3:56, SPX hit its low of 6882, so the 6910 put was about $27 in the money
In the final minute, SPX ripped back to 6918
The official close came in at 6910.39 after the closing auction
So the 6910 put expired worthless by just 39 cents after at one point being worth $2,700.
4pm: “and… it’s gone.”
As it goes, for every buyer exists a seller, and unfortunately, a meaningful chunk of sellers on Friday were retail.
I rebuilt the retail side of Friday’s trades using the same retail filter as our 2.7 million trade post, which roughly works as follows:
Find the retail trades
Retail options orders mostly run through price-improvement auctions, and those trades carry specific condition codes in historical trade records. That gave us about 320,000 retail trades on Friday.
Figure out who bought and who sold
It’s impossible to know with 100% certainty, but the standard heuristic in academia is: a trade near/at the ask is a retail buy, and a trade near/below the bid is a retail sell (i.e., crossing the bid-ask spread). About 18% filled right at the midpoint, so there’s no way to tell, and those are left out.
Stitch the spreads back together
Legs that hit the same exchange in the same millisecond get rebuilt into the spread, condor, or butterfly families they came from, which was about 27,000 identifiable spreads on Friday.
Mark everything to 4pm
Every 0-DTE option is worth exactly its settlement value at the close, so adding up every retail trade marked to the close gives us retail’s P&L for the day, no matter when anyone got in or out.
The numbers below are before commissions and cover the trades we could identify:
Friday: retail lost about $21.0 million
Thursday: retail lost about $21.2 million
Quiet October Friday: retail made about $3.5 million
Interestingly enough, almost all of Friday’s loss came from selling puts:
Retail’s put trades lost $22.9 million, while their call trades actually made $1.9 million
What’s also interesting is the timing of the trades, as the trades between 10:00-10:45 (starting right at the high of the day), represented the bulk of the activity and losses:
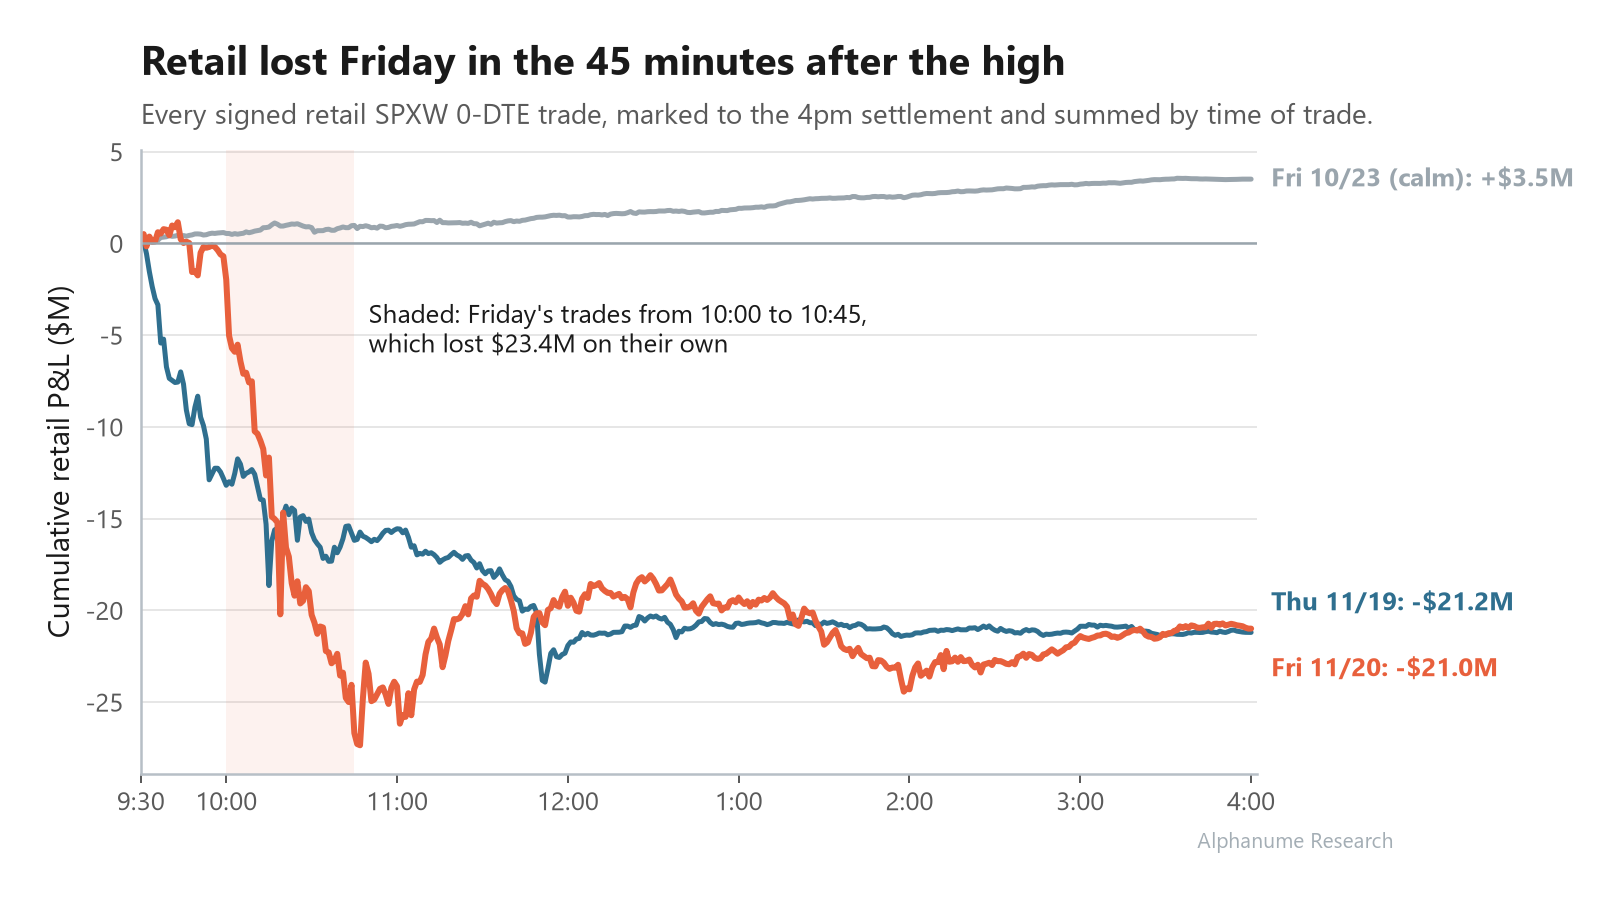
Those were also the same 45 minutes when the options chain was underpricing realized vol, which kind of adds insult to injury (selling puts at the top + getting cheap prices for the risk).
Final Thoughts
Initially, I expected near-perfect efficiency where realized vol might’ve been above implied for a few minutes, but things would quickly reprice. I still can’t think of why ivol stood completely still for almost 2 hours when rvol had already far outpaced it.
It’s also interesting how the extremely high vol of the prior day, or even the prior week, didn’t result in a substantially higher figure at open. It’s usually the case that the vol premium in those periods makes selling the +EV wager, but as demonstrated, things just took awhile to catch up this time.
Lastly, you don’t see 30x payouts every day in 0-DTE (outside of last minute gambles), but it was kind of wild to see huge chunks of the chain where that was the minimum.
I’m not in the business of making short-term vol callouts, so I have no view on what it’ll do next week, but whatever happens, it’ll definitely be interesting.
As always, thanks for reading, and we’ll see you in the next one.