

Two days ago, a Chinese sewage-treatment company called CDT Environmental (CDTG) went from $4.78 to $7.78 in 16 minutes.
At ~2pm, the trade log seemed to glitch out on itself as 40,000 shares printed at exactly $7.78, over and over, like the price had hit a wall.
Then, the stock stopped trading entirely.
Now, everyone already knows about trading halts at a high-level:
“a stock moves around a lot, it gets halted, re-opens, maybe halts again, maybe it doesn’t.“
But when you think about it on a more granular-level, you begin to wonder if that’s really all there is to it:
After a halt, does price tend to revert in the direction it halted in?
If not, does it continue its momentum?
Are you able to predict the likelihood of a halt before its official?
If you could, would it even be profitable to do so?
Would you be able to place the order in time?
When you have these kind of niche research questions, you’ll often find that the only way to answer them is to just get your hands dirty and look into the data yourself.
So, that’s exactly what we did.
“Trading halts are weird, but when they happen, can they be turned into repeatable, harvestable edges?”
How does this stuff even work?
As usual, it’s important that we start from first-principles.
LULD stands for Limit Up-Limit Down, the mechanism the exchanges rolled out after the 2010 flash crash. Thankfully, the exact rules behind it are wide-open and public.
To keep things short:
Every stock has a reference price: the average trade price over the last 5 minutes, republished every 30 seconds.
There’s usually a band around that reference price:
For large caps (S&P 500, Russell 1000) it’s 5%, doubling to 10% in the last 25 minutes of the day (3:35 to 4:00).
For everything else above $3 it’s a flat 10%, and between $0.75 and $3 it’s 20%, doubling to 40% into the close.
If the best bid rises above the upper band (or the best ask below the lower) for 15 seconds straight, it becomes a “limit state” and the stock goes into a 5-minute trading pause.
The listing exchange then reopens it with an auction, the same mechanism as the opening cross.
If it can’t find a clean price, the pause can stretch to 10 minutes before other venues are allowed to resume on their own.
So, going back to our CDTG example from earlier, that constant $7.78 print was it entering that limit state and essentially being glued to that upper band.
They happen literally EVERY day
I expected halts to be rare, maybe a few a week, only reserved for clear info-driven outliers, but the data did not agree with that.
Exchanges publish every halt with timestamps (NYSE’s log covers Nasdaq listings too), and I pulled 17 trading days of it, July 27 through August 18.
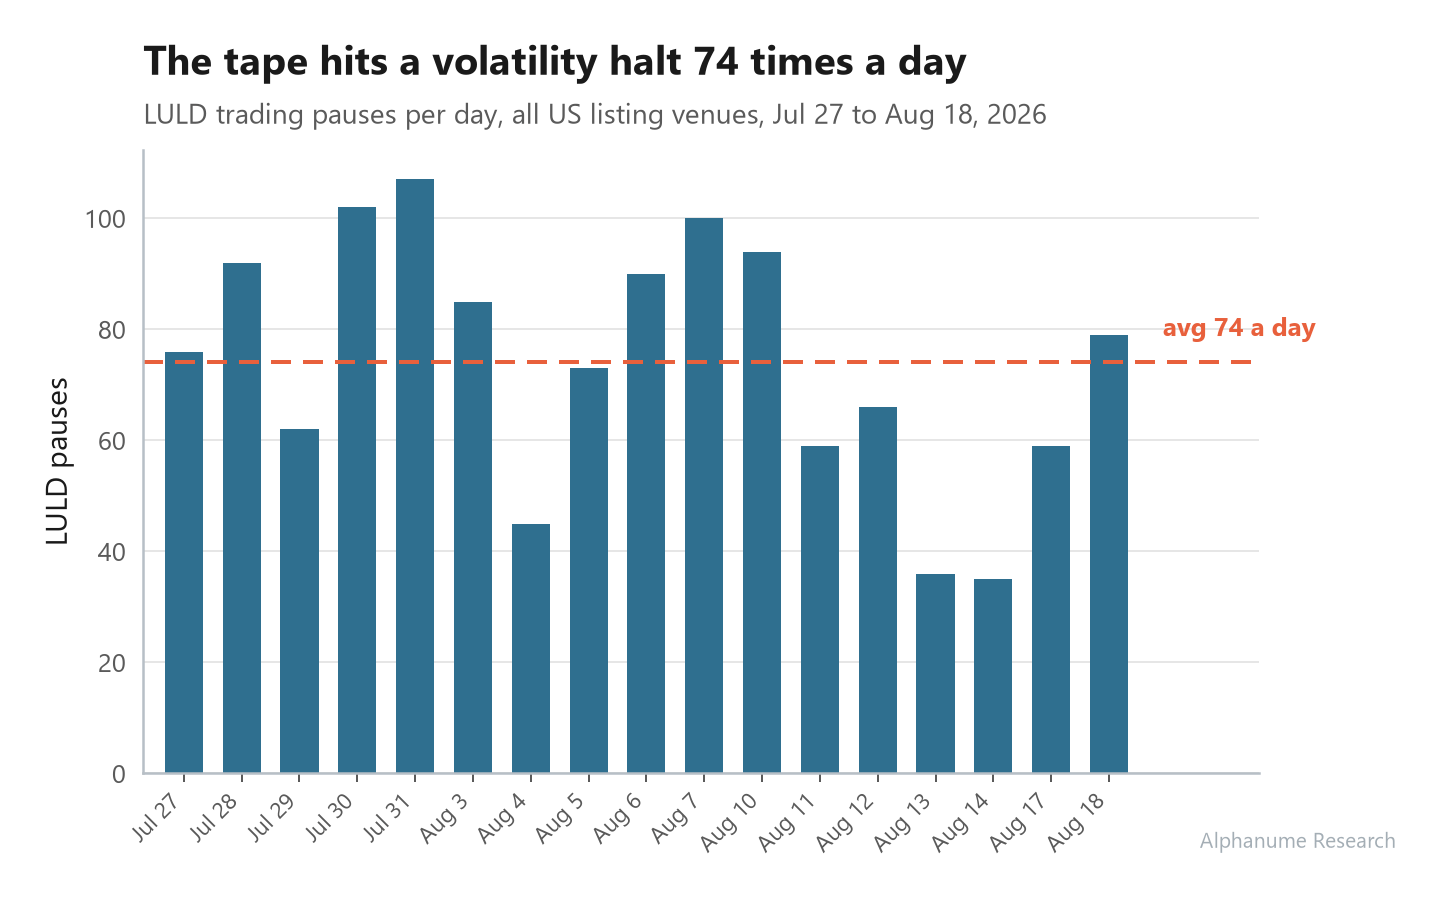
1,260 LULD pauses in 17 days, so ~74 per day
467 unique ticker-days had at least one volatility halt.
One stock,
AIXC, halted 24 times in a single session yesterday. Another,YXT, managed 30 on August 5.
There’s not a single quiet day anywhere in the sample (chart below).
Now, most of these are $2 stocks doing $2-stock things, but the interesting part is what they do after the halt is over.