

Global X published its August covered-call commentary a few days ago, and one line in it says something pretty strange: since launching in February, their weekly-reset funds have held a beta of roughly 0.9 to their indexes while targeting annual distributions of 9% and 13%.
In other words, you keep 90% of the market and get paid double digits for it.
Numbers like that didn’t make any sense to me, as my initial thought process went along the lines of “if you can have that, then why invest in anything else?”
These high-yield option ETFs have been out for a few years now, but there doesn’t seem to be any rigorous, data-based insight on whether these are just self-liquidation schemes (i.e., “NAV erosion”) or actual, legit products.
So, I spent the week pulling data to answer an incredibly simple question:
“Are these things legit, or not?”
The answer is… sort of.
To get things started, I first established a universe size of ~17, covering the typical names like JEPI, the weekly 0-DTE funds, and the YieldMax funds (the triple digit APY guys).
For each fund, I pulled every dividend, split, close, and any other data point I could for the last 12 months, then computed three numbers per share:
Distributions paid: every dividend over the window, converted to today’s share basis (after a reverse split, one of today’s shares is several of last year’s, so the old checks get scaled up to match)
NAV change: what the share price itself did over the same window, split-adjusted
Coverage: distributions plus NAV change, divided by distributions. At 1.0, the fund earned exactly what it paid you. Below 1.0, the check was your own capital coming back.
The share-basis part matters more than you’d think as my first pass had TSLY “gaining” 185% when it actually lost 43%, so if you’ve ever audited these funds on raw price history and gotten nonsense, that’s why.
Now, if you’re still reading despite that onslaught of technical terms, thank you.
To try making things a bit easier, let’s start with a visual on what the first run came up with:
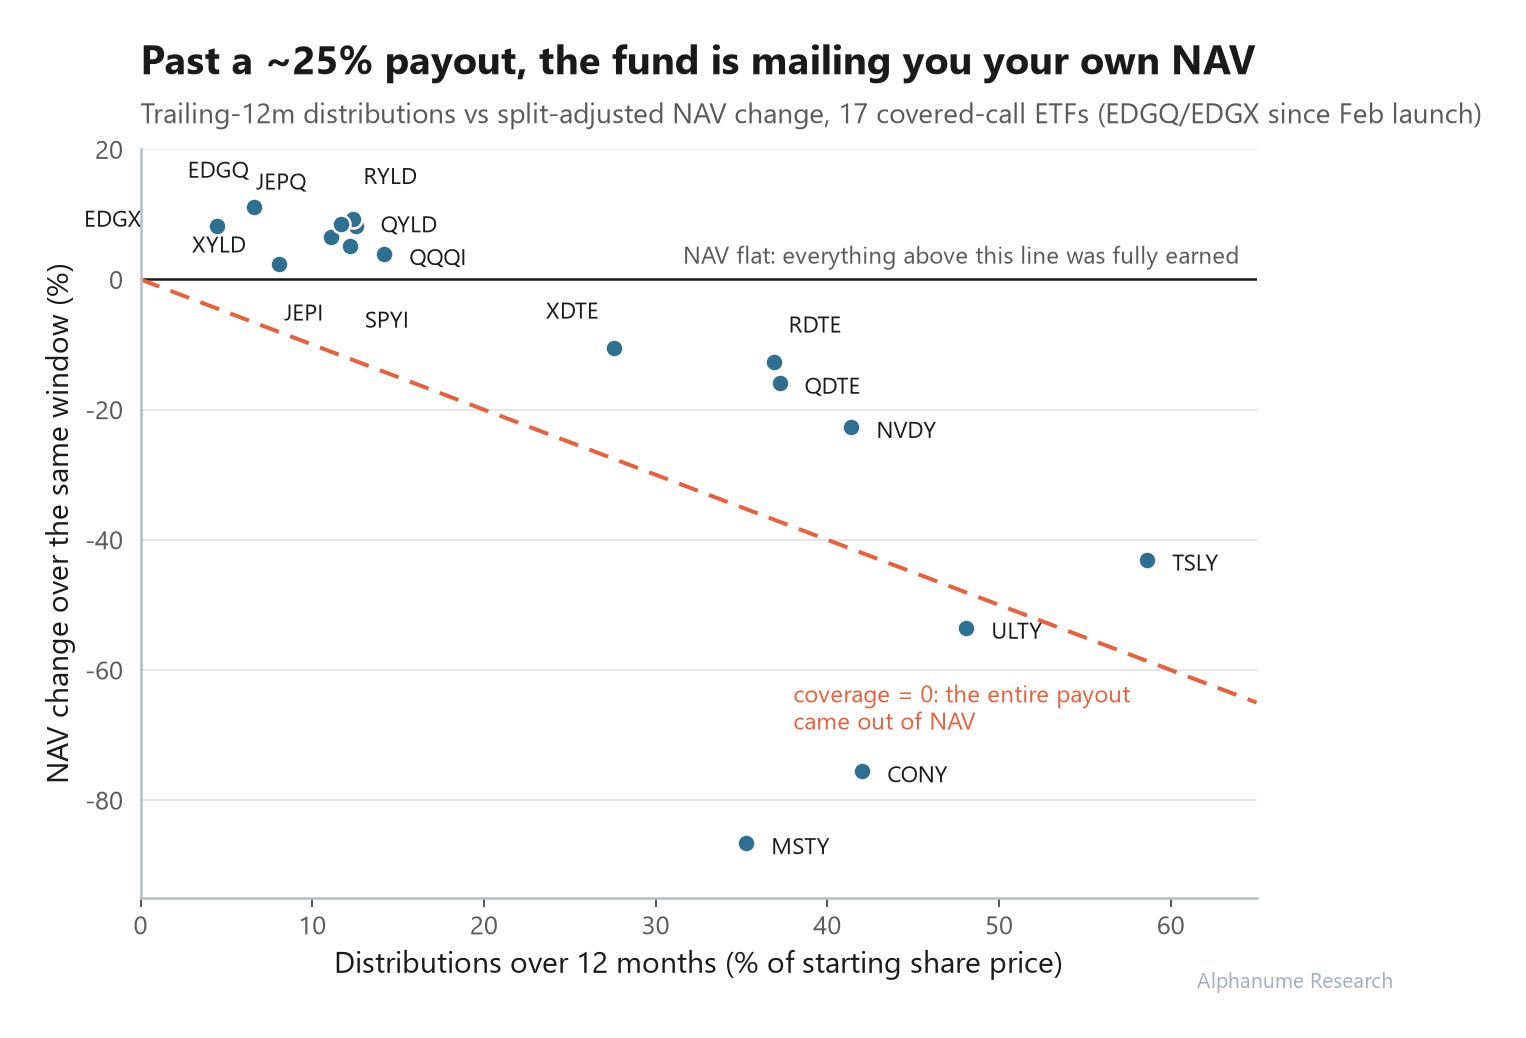
The big dogs are pretty legit
Because we’re optimists, we’ll start with the good.
Looking at the funds everyone’s parents own, the big-picture is that they actually make much more than they pay out:
QYLDpaid 12.5% of its year-ago share price and its NAV still rose 8.1%. Coverage: 1.65.JEPQpaid 11.7%, NAV up 8.5%, coverage 1.73.JEPI,XYLD,RYLD,SPYI, andQQQIall landed between 1.27 and 1.75.
Zero of the seven monthly index funds handed back a dime of your capital over the last year.
The weekly machines aren't all there
The Roundhill 0DTE funds sell same-day calls every morning and mail a check every Friday, and the findings are pretty much speak for themselves: